Introduction
IT Operations Analytics platforms are advanced systems that collect, analyze, and correlate data from IT infrastructure, applications, networks, and logs to improve performance, detect anomalies, and support faster incident resolution. In simple terms, they help IT teams understand what is happening inside complex IT environments before problems impact users.
These platforms combine machine learning, log analytics, observability, and predictive insights to move IT operations from reactive troubleshooting to proactive and even predictive management. Instead of waiting for outages, teams can detect patterns, predict failures, and automatically trigger remediation workflows.
In 2026, IT environments are more complex than ever due to hybrid cloud, Kubernetes, microservices, distributed systems, and AI-driven workloads. Traditional monitoring tools are no longer enough because they generate too much data without enough actionable insights. IT Operations Analytics platforms solve this by correlating signals across systems and identifying root causes faster.
Common real-world use cases include predicting system failures, detecting performance bottlenecks, reducing mean time to resolution, analyzing application logs, monitoring cloud infrastructure health, identifying anomalies in user behavior, and optimizing IT resource usage.
When evaluating these platforms, buyers should consider data ingestion capability, real-time analytics, machine learning features, integration ecosystem, scalability, log and metric correlation, alert accuracy, dashboard usability, automation support, and cost efficiency.
Best for: IT operations teams, DevOps engineers, SRE teams, enterprise IT administrators, cloud infrastructure teams, and organizations running complex hybrid or multi-cloud environments.
Not ideal for: very small IT environments, static infrastructure setups, or teams without distributed systems.
Key Trends in IT Operations Analytics Platforms
- AI-driven anomaly detection replacing rule-based monitoring systems
- Full-stack observability combining logs, metrics, traces, and events
- Predictive analytics for incident prevention instead of reactive fixes
- AIOps platforms becoming central to enterprise IT operations
- Deep integration with Kubernetes and cloud-native environments
- Real-time streaming analytics for faster incident detection
- Automated root cause analysis reducing manual troubleshooting
- Integration with DevSecOps pipelines for unified operations visibility
- Cost-aware IT analytics combining performance and FinOps insights
- Unified observability platforms replacing fragmented monitoring tools
Modern IT operations are shifting toward intelligent systems that not only detect issues but also recommend or automate fixes using machine learning models. This reduces downtime and improves operational efficiency across large-scale infrastructures.
How We Selected These Tools
- Focused on platforms designed for IT Operations Analytics and AIOps
- Included tools supporting logs, metrics, traces, and event correlation
- Prioritized machine learning and anomaly detection capabilities
- Evaluated scalability for enterprise IT and cloud environments
- Considered integration with DevOps and observability ecosystems
- Included both enterprise and developer-friendly platforms
- Focused on real-time analytics and incident management features
- Assessed automation and root cause analysis capabilities
- Considered multi-cloud and hybrid IT support
- Avoided basic monitoring tools without analytics depth
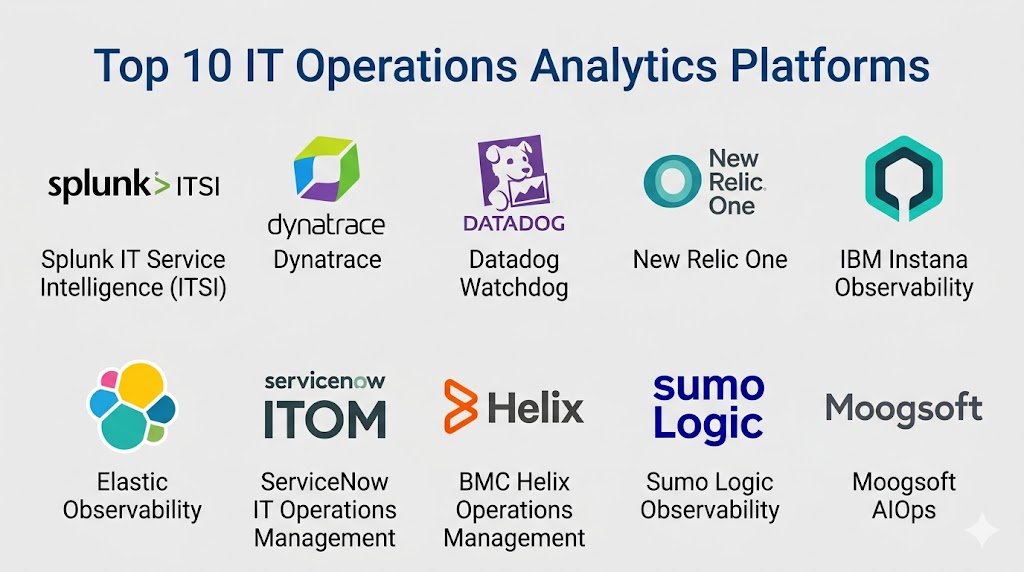
Top 10 IT Operations Analytics Platforms
1- Splunk IT Service Intelligence
Short description: Splunk IT Service Intelligence is a powerful IT operations analytics platform built on Splunk’s data analytics engine. It provides real-time insights into IT infrastructure, application performance, and service health. It is widely used in enterprise environments for log analytics and AIOps-driven incident management.
Key Features
- Real-time IT service monitoring and analytics
- Machine learning-based anomaly detection
- Log, metric, and event correlation
- Predictive incident identification
- Service health dashboards
- Root cause analysis capabilities
- IT service dependency mapping
Pros
- Extremely powerful data analytics engine
- Strong enterprise adoption
- Deep log and event correlation
- Highly customizable dashboards
Cons
- Complex setup and configuration
- High cost for enterprise usage
- Requires expertise to operate effectively
- Resource intensive
Platforms / Deployment
Cloud. On-premise. Hybrid.
Security & Compliance
Supports RBAC, audit logging, encryption, and enterprise compliance frameworks. Exact certifications depend on deployment.
Integrations & Ecosystem
- ITSM tools
- Cloud platforms
- DevOps pipelines
- Security tools
- Monitoring systems
Support & Community
Strong enterprise support and large global user community.
2- Datadog
Short description: Datadog is a cloud-native observability and IT analytics platform that provides monitoring, logging, and AIOps capabilities. It is widely used for infrastructure monitoring, application performance management, and cloud observability.
Key Features
- Infrastructure monitoring and analytics
- Log management and correlation
- Application performance monitoring
- AI-driven anomaly detection
- Real-time dashboards
- Kubernetes and cloud monitoring
- Incident detection and alerting
Pros
- Strong cloud-native observability
- Easy setup and integration
- Powerful visualization tools
- Broad ecosystem coverage
Cons
- Can become expensive at scale
- Requires tuning for alert noise
- Complex pricing model
- High data ingestion costs
Platforms / Deployment
Cloud SaaS.
Security & Compliance
Supports enterprise security controls including encryption, RBAC, and audit logs. Certifications vary by configuration.
Integrations & Ecosystem
- AWS
- Azure
- Google Cloud
- Kubernetes
- DevOps tools
- ITSM systems
Support & Community
Strong documentation and enterprise support plans.
3- Dynatrace
Short description: Dynatrace is an AI-powered IT operations analytics and observability platform that provides full-stack monitoring with automated root cause analysis. It is widely used in enterprise environments for proactive IT operations management.
Key Features
- AI-driven root cause analysis
- Full-stack observability
- Infrastructure and application monitoring
- Real user monitoring
- Kubernetes and cloud monitoring
- Automatic dependency mapping
- Predictive analytics
Pros
- Strong AI automation capabilities
- Excellent root cause analysis
- Full-stack observability coverage
- Easy scalability
Cons
- Enterprise pricing model
- Requires configuration for advanced features
- Learning curve for full platform
- Less flexible customization compared to open tools
Platforms / Deployment
Cloud SaaS. Hybrid deployment options.
Security & Compliance
Supports enterprise security standards including RBAC, encryption, and compliance frameworks. Not publicly stated for certifications.
Integrations & Ecosystem
- Cloud platforms
- Kubernetes
- DevOps tools
- ITSM systems
- CI CD pipelines
Support & Community
Strong enterprise support with AI-driven monitoring expertise.
4- New Relic
Short description: New Relic is a cloud observability platform that provides IT operations analytics, application monitoring, and infrastructure insights. It is widely used for performance monitoring and incident detection.
Key Features
- Application performance monitoring
- Infrastructure monitoring
- Log analytics and correlation
- Distributed tracing
- AI-powered anomaly detection
- Real-time dashboards
- Incident alerting
Pros
- Easy to use interface
- Strong observability coverage
- Good developer experience
- Flexible data visualization
Cons
- Pricing increases with usage
- Requires tuning for large environments
- Advanced features require configuration
- Can generate alert noise
Platforms / Deployment
Cloud SaaS.
Security & Compliance
Supports enterprise-grade security including RBAC and encryption. Compliance varies by deployment.
Integrations & Ecosystem
- AWS
- Azure
- Google Cloud
- Kubernetes
- DevOps pipelines
- Monitoring tools
Support & Community
Strong developer community and enterprise support options.
5- IBM Instana Observability
Short description: IBM Instana is an AI-driven observability and IT operations analytics platform that provides automated monitoring and root cause analysis for modern applications and infrastructure.
Key Features
- Automated application discovery
- Real-time observability
- AI-powered root cause detection
- Infrastructure monitoring
- Kubernetes and microservices monitoring
- Distributed tracing
- Performance analytics
Pros
- Strong automation and AI capabilities
- Excellent microservices monitoring
- Fast deployment and setup
- Good enterprise scalability
Cons
- Enterprise-focused pricing
- Requires learning curve
- Limited customization in some areas
- Best suited for complex environments
Platforms / Deployment
Cloud SaaS. Hybrid.
Security & Compliance
Supports enterprise authentication, RBAC, and audit logging. Compliance depends on deployment configuration.
Integrations & Ecosystem
- IBM Cloud
- Kubernetes
- AWS
- Azure
- DevOps tools
- Monitoring systems
Support & Community
Strong IBM enterprise support ecosystem.
6- Elastic Observability
Short description: Elastic Observability is built on the Elastic Stack and provides log analytics, metrics, and AIOps capabilities for IT operations. It is widely used for large-scale log analysis and observability.
Key Features
- Log analytics and search engine
- Infrastructure monitoring
- Application performance tracking
- Machine learning anomaly detection
- Dashboard visualization tools
- Kubernetes monitoring
- Event correlation
Pros
- Extremely powerful search and analytics
- Flexible deployment options
- Strong open-source foundation
- Scalable architecture
Cons
- Requires expertise to manage
- Complex setup for beginners
- Resource intensive at scale
- Requires tuning for performance
Platforms / Deployment
Cloud SaaS. Self-hosted. Hybrid.
Security & Compliance
Supports encryption, RBAC, and enterprise security controls. Compliance depends on deployment setup.
Integrations & Ecosystem
- Cloud platforms
- DevOps tools
- Kubernetes
- ITSM systems
- Security tools
Support & Community
Strong open-source and enterprise support ecosystem.
7- SolarWinds Hybrid Cloud Observability
Short description: SolarWinds Hybrid Cloud Observability provides IT operations analytics for hybrid environments, combining infrastructure monitoring, application performance tracking, and log analytics.
Key Features
- Hybrid infrastructure monitoring
- Application performance monitoring
- Network performance analytics
- Log management and correlation
- Dependency mapping
- Alerting and dashboards
- Cloud resource monitoring
Pros
- Strong hybrid environment support
- Good network monitoring capabilities
- Easy to deploy
- Centralized monitoring platform
Cons
- Less advanced AI capabilities
- Enterprise licensing costs
- Limited cloud-native depth
- Requires tuning for large environments
Platforms / Deployment
Cloud SaaS. On-premise hybrid.
Security & Compliance
Supports enterprise security controls and audit logging. Not publicly stated for certifications.
Integrations & Ecosystem
- AWS
- Azure
- Network tools
- ITSM systems
- DevOps pipelines
Support & Community
Enterprise support with IT operations focus.
8- PagerDuty Operations Cloud
Short description: PagerDuty is an incident management and IT operations analytics platform that focuses on alerting, response automation, and operational intelligence.
Key Features
- Incident detection and response automation
- IT operations analytics
- Alert correlation and routing
- On-call management system
- Event intelligence engine
- Root cause insights
- Workflow automation
Pros
- Strong incident management capabilities
- Excellent alerting system
- Good DevOps integration
- Fast incident response
Cons
- Not a full observability platform
- Requires integration with monitoring tools
- Pricing scales with usage
- Limited infrastructure monitoring
Platforms / Deployment
Cloud SaaS.
Security & Compliance
Supports enterprise authentication, RBAC, and audit logging.
Integrations & Ecosystem
- Datadog
- New Relic
- AWS
- Azure
- DevOps tools
- Monitoring platforms
Support & Community
Strong enterprise support and incident management ecosystem.
9- LogicMonitor
Short description: LogicMonitor is a cloud-based IT infrastructure monitoring and analytics platform designed for hybrid IT environments. It provides automated discovery and performance analytics.
Key Features
- Infrastructure monitoring and analytics
- Cloud and hybrid environment support
- Automated device discovery
- Log and metric correlation
- Performance dashboards
- Alerting and incident detection
- Dependency mapping
Pros
- Strong hybrid monitoring capabilities
- Easy deployment
- Good automation features
- Scalable architecture
Cons
- Limited deep AI capabilities
- Enterprise pricing model
- Requires tuning for large systems
- UI complexity in large environments
Platforms / Deployment
Cloud SaaS.
Security & Compliance
Supports enterprise security controls including RBAC and encryption.
Integrations & Ecosystem
- AWS
- Azure
- Kubernetes
- ITSM tools
- DevOps systems
Support & Community
Strong enterprise support and documentation.
10- ServiceNow IT Operations Management
Short description: ServiceNow IT Operations Management is a unified IT operations analytics and service management platform that combines monitoring, automation, and incident management.
Key Features
- IT service and operations analytics
- Event and incident management
- CMDB-based dependency mapping
- AI-driven anomaly detection
- Workflow automation
- Infrastructure monitoring integration
- Root cause analysis
Pros
- Strong enterprise ITSM integration
- Unified IT operations platform
- Good automation capabilities
- Strong governance features
Cons
- Complex implementation
- High enterprise cost
- Requires ServiceNow ecosystem adoption
- Learning curve for configuration
Platforms / Deployment
Cloud SaaS.
Security & Compliance
Supports enterprise-grade security, RBAC, audit logs, and compliance frameworks.
Integrations & Ecosystem
- AWS
- Azure
- DevOps tools
- Monitoring platforms
- ITSM systems
Support & Community
Strong enterprise support and global ITSM ecosystem.
Comparison Table
| Tool Name | Best For | Platforms Supported | Deployment | Standout Feature | Public Rating |
|---|---|---|---|---|---|
| Splunk ITSI | Log-heavy enterprise analytics | Multi-platform | Hybrid | Deep log correlation | N/A |
| Datadog | Cloud observability | Cloud | SaaS | Unified monitoring platform | N/A |
| Dynatrace | AI-driven AIOps | Cloud hybrid | SaaS | Automatic root cause analysis | N/A |
| New Relic | Application performance | Cloud | SaaS | Developer-friendly observability | N/A |
| IBM Instana | Microservices monitoring | Cloud hybrid | SaaS | AI observability engine | N/A |
| Elastic Observability | Log analytics at scale | Multi-platform | Hybrid | Search-based analytics | N/A |
| SolarWinds | Hybrid IT monitoring | Hybrid | SaaS on-prem | Network + cloud monitoring | N/A |
| PagerDuty | Incident response | Cloud | SaaS | Incident automation | N/A |
| LogicMonitor | Infrastructure monitoring | Hybrid | SaaS | Automated discovery | N/A |
| ServiceNow ITOM | Enterprise IT operations | Multi-platform | SaaS | ITSM integrated AIOps | N/A |
Evaluation and Scoring of IT Operations Analytics Platforms
| Tool Name | Core 25% | Ease 15% | Integrations 15% | Security 10% | Performance 10% | Support 10% | Value 15% | Weighted Total |
|---|---|---|---|---|---|---|---|---|
| Splunk ITSI | 10 | 7 | 10 | 10 | 9 | 10 | 7 | 8.85 |
| Datadog | 9 | 9 | 10 | 9 | 9 | 9 | 8 | 9.05 |
| Dynatrace | 10 | 8 | 9 | 10 | 10 | 9 | 8 | 9.15 |
| New Relic | 9 | 9 | 9 | 9 | 9 | 8 | 8 | 8.75 |
| IBM Instana | 9 | 8 | 9 | 9 | 9 | 9 | 8 | 8.80 |
| Elastic Observability | 9 | 7 | 9 | 9 | 9 | 8 | 9 | 8.55 |
| SolarWinds | 8 | 8 | 8 | 8 | 8 | 8 | 8 | 8.00 |
| PagerDuty | 8 | 9 | 10 | 9 | 9 | 9 | 8 | 8.65 |
| LogicMonitor | 8 | 8 | 8 | 8 | 8 | 8 | 8 | 8.00 |
| ServiceNow ITOM | 9 | 7 | 10 | 10 | 9 | 10 | 7 | 8.75 |
These scores reflect observability depth, AI-driven analytics, scalability, integration strength, automation capability, and enterprise readiness. Dynatrace and Datadog lead in modern cloud-native observability, while Splunk excels in log-heavy enterprise environments. ServiceNow ITOM stands out for ITSM integration, and PagerDuty dominates incident response workflows.
Which IT Operations Analytics Platform Is Right for You
Solo / Freelancer
Solo users typically do not need full IT operations analytics platforms. Lightweight monitoring tools or basic cloud dashboards are sufficient.
SMB
SMBs benefit from simple, cloud-native tools. Datadog, New Relic, and LogicMonitor are strong choices for ease of use and quick setup.
Mid-Market
Mid-market organizations need scalability and AIOps capabilities. Datadog, Dynatrace, Elastic Observability, and PagerDuty are strong options.
Enterprise
Enterprises require deep analytics, log correlation, and ITSM integration. Splunk ITSI, ServiceNow ITOM, Dynatrace, IBM Instana, and Datadog are leading choices.
Budget vs Premium
Open-source or lower-cost tools like Elastic Observability offer strong flexibility. Premium platforms like Dynatrace and Splunk provide advanced AI and enterprise automation.
Feature Depth vs Ease of Use
Dynatrace offers deep AI automation. Datadog and New Relic are easier to adopt. Splunk provides powerful analytics but requires expertise.
Integrations & Scalability
Datadog, Splunk, and ServiceNow offer the strongest integration ecosystems. Elastic and Dynatrace scale well for cloud-native environments.
Security & Compliance Needs
Enterprises with strict compliance requirements should prioritize Splunk, ServiceNow ITOM, Dynatrace, and IBM Instana due to governance and audit capabilities.
Frequently Asked Questions FAQs
1. What is IT operations analytics?
IT operations analytics is the process of analyzing IT data such as logs, metrics, and events to improve system performance and detect issues. It helps IT teams understand system behavior. It uses AI and machine learning for insights. It improves operational efficiency.
2. What is AIOps?
AIOps stands for Artificial Intelligence for IT Operations. It uses AI and machine learning to automate IT monitoring and incident response. It helps detect anomalies and predict failures. It reduces manual troubleshooting effort.
3. Why are IT operations analytics tools important?
They are important because modern IT systems are complex and generate large amounts of data. These tools help identify problems quickly. They reduce downtime and improve performance. They also enable proactive IT management.
4. What data do these platforms analyze?
They analyze logs, metrics, traces, events, and system telemetry. They also analyze application performance data. Some platforms include user behavior data. This helps create a full picture of system health.
5. What is the difference between monitoring and IT analytics?
Monitoring shows system status and alerts. IT analytics goes deeper by analyzing patterns and predicting issues. Monitoring is reactive, while analytics is proactive. IT analytics uses AI and correlation.
6. Are IT operations analytics platforms cloud-based?
Many modern platforms are cloud-based SaaS solutions. However, some also support hybrid and on-premise deployments. Enterprises often use hybrid models. Cloud-native platforms are becoming more common.
7. Do these tools use AI?
Yes, most modern IT operations analytics platforms use AI and machine learning. They detect anomalies and predict system failures. AI improves root cause analysis. It reduces alert noise.
8. Can these tools prevent outages?
They cannot completely prevent outages but can detect early warning signs. This helps teams fix issues before they escalate. Predictive analytics reduces downtime. It improves system reliability.
9. What is observability?
Observability is the ability to understand system behavior using logs, metrics, and traces. It helps engineers debug complex systems. It is a core part of IT operations analytics. It goes beyond traditional monitoring.
10. How do companies choose the right platform?
Companies choose based on infrastructure size, cloud usage, budget, and integration needs. Datadog and New Relic are good for ease of use. Splunk and ServiceNow are best for enterprises. Dynatrace is strong for AI-driven operations.
Conclusion
IT operations analytics platforms are essential for managing modern hybrid and cloud-native IT environments. They help organizations move from reactive monitoring to proactive and predictive operations using AI, automation, and observability. Tools like Dynatrace and Datadog lead in cloud-native observability, while Splunk ITSI excels in enterprise log analytics and ServiceNow ITOM integrates deeply with IT service management. New Relic, Elastic, and IBM Instana provide strong alternatives depending on architecture and scale. The best approach is to combine observability, AIOps, and incident automation to ensure faster detection, reduced downtime, and improved operational efficiency across IT systems.