Introduction
Database Monitoring Tools are software solutions that help organizations track, analyze, and optimize database performance in real time. They continuously monitor metrics such as query performance, CPU usage, memory consumption, latency, and uptime to ensure databases run efficiently and reliably.
In modern cloud-first environments, databases are distributed across multi-cloud, hybrid, and on-premise systems, making monitoring more critical than ever. These tools help teams detect slow queries, prevent downtime, identify bottlenecks, and improve application performance.
Database monitoring tools are essential for DBAs, DevOps teams, SREs, and IT operations teams managing mission-critical systems.
Common use cases include:
- Real-time database performance monitoring
- Query optimization and slow query detection
- Resource usage tracking (CPU, memory, I/O)
- Automated alerts for anomalies and failures
- Capacity planning and scaling insights
- SLA and uptime monitoring
Key evaluation criteria:
- Real-time monitoring capabilities
- Query performance analysis
- Multi-database support (SQL & NoSQL)
- Alerting and anomaly detection
- Cloud and hybrid compatibility
- Dashboard and visualization quality
- Integration with DevOps tools (SIEM, APM, etc.)
- Scalability and performance impact
Best for: Enterprises, SaaS companies, fintech platforms, cloud-native applications, and IT operations teams.
Not ideal for: Small static applications with minimal database usage or non-critical systems.
Key Trends in Database Monitoring Tools
- AI-driven anomaly detection for real-time issues
- Unified observability platforms combining logs, metrics, and traces
- Cloud-native monitoring for AWS, Azure, and GCP databases
- Predictive analytics for performance and capacity planning
- Automated root cause analysis (RCA)
- Integration with DevOps and CI/CD pipelines
- Support for multi-database and hybrid environments
- Open-source monitoring stacks (Grafana, Prometheus, etc.)
- Real-time query optimization recommendations
- Cost-aware monitoring for cloud databases
How We Selected These Tools (Methodology)
- Strong adoption across enterprise and cloud environments
- Support for multiple database engines (SQL + NoSQL)
- Real-time monitoring and alerting capabilities
- Query performance analysis and optimization features
- Integration with DevOps, cloud, and observability tools
- Scalability for large distributed systems
- Ease of deployment and usability
- Security and compliance readiness
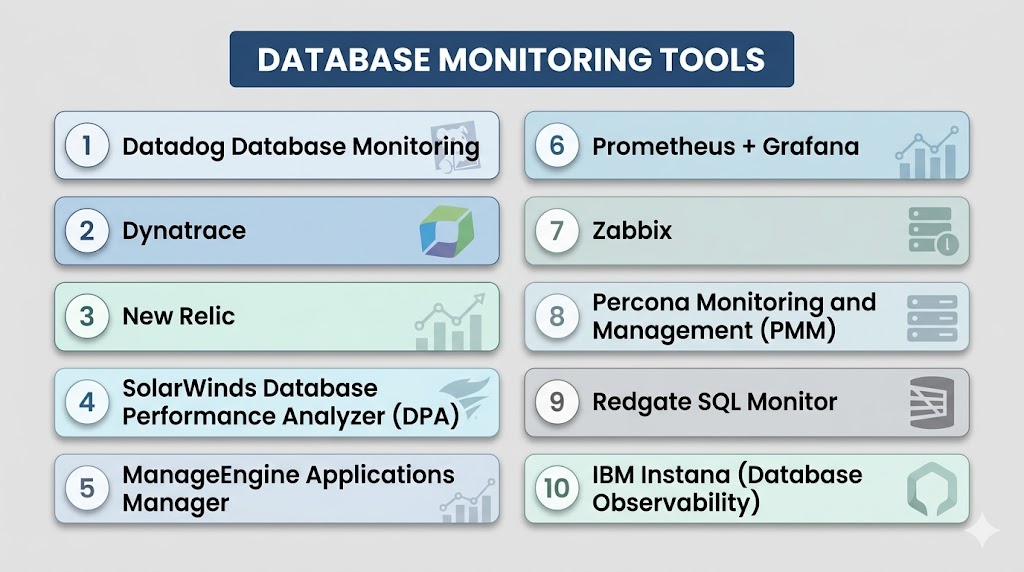
Top 10 Database Monitoring Tools
#1 — SolarWinds Database Performance Analyzer (DPA)
Short description: A powerful database monitoring solution that provides deep performance insights, query analysis, and historical trend tracking across multiple database platforms.
Key Features
- Query performance analysis
- Wait-time monitoring
- Multi-database support (SQL, Oracle, MySQL)
- Historical performance tracking
- Alerting and reporting dashboards
Pros
- Deep performance insights
- Excellent for enterprise DBAs
Cons
- High cost
- Complex setup
Platforms / Deployment
Cloud / On-premise
Security & Compliance
Audit logs, secure monitoring; Not publicly stated
Integrations & Ecosystem
- Cloud platforms
- DevOps tools
- SIEM systems
Support & Community
Strong enterprise support
#2 — Datadog Database Monitoring
Short description: A unified observability platform that provides real-time database performance tracking across cloud and hybrid environments.
Key Features
- Real-time query monitoring
- AI anomaly detection
- Cloud database integration
- Custom dashboards
- Alerting system
Pros
- Excellent cloud integration
- Unified observability
Cons
- Expensive at scale
- Requires configuration
Platforms / Deployment
Cloud
Security & Compliance
Encryption, RBAC; Not publicly stated
Integrations & Ecosystem
- AWS, Azure, GCP
- DevOps tools
- APIs
Support & Community
Strong enterprise support
#3 — Dynatrace
Short description: An AI-powered observability platform offering advanced database monitoring with automatic root cause analysis.
Key Features
- AI-powered anomaly detection
- Automatic root cause analysis
- Full-stack monitoring
- Database performance tracking
- Real-time alerts
Pros
- Strong AI automation
- End-to-end visibility
Cons
- High cost
- Learning curve
Platforms / Deployment
Cloud / Hybrid
Security & Compliance
Enterprise-grade encryption; Not publicly stated
Integrations & Ecosystem
- Cloud platforms
- Kubernetes
- DevOps tools
Support & Community
Strong enterprise support
#4 — New Relic
Short description: A cloud-native monitoring platform that provides database performance insights along with application observability.
Key Features
- Database query monitoring
- Real-time dashboards
- Application performance monitoring
- Alerting system
- Distributed tracing
Pros
- Easy-to-use interface
- Strong observability features
Cons
- Pricing complexity
- Limited deep DB tuning
Platforms / Deployment
Cloud
Security & Compliance
Encryption; Not publicly stated
Integrations & Ecosystem
- Cloud services
- APIs
- DevOps tools
Support & Community
Strong support
#5 — Prometheus + Grafana
Short description: An open-source monitoring stack widely used for custom database and infrastructure monitoring with visualization capabilities.
Key Features
- Metrics collection (Prometheus)
- Visualization dashboards (Grafana)
- Alerting system
- Multi-source integration
- Custom queries
Pros
- Free and highly flexible
- Strong community support
Cons
- Requires setup expertise
- No built-in DB insights
Platforms / Deployment
Cloud / On-premise
Security & Compliance
Depends on configuration; Not publicly stated
Integrations & Ecosystem
- Kubernetes
- Databases
- APIs
Support & Community
Strong open-source community
#6 — ManageEngine Applications Manager
Short description: A comprehensive IT monitoring tool that includes database performance monitoring across multiple database engines.
Key Features
- Database performance tracking
- Query monitoring
- Alerting system
- Infrastructure monitoring
- Dashboard analytics
Pros
- All-in-one monitoring suite
- Easy deployment
Cons
- UI complexity
- Limited deep DB tuning
Platforms / Deployment
Cloud / On-premise
Security & Compliance
Encryption; Not publicly stated
Integrations & Ecosystem
- Enterprise systems
- APIs
- Cloud tools
Support & Community
Good enterprise support
#7 — Zabbix
Short description: An open-source monitoring platform that supports database performance tracking along with infrastructure monitoring.
Key Features
- Database monitoring templates
- Real-time alerts
- Custom metrics tracking
- Dashboard visualization
- Auto-discovery
Pros
- Free and flexible
- Strong scalability
Cons
- Complex setup
- Requires tuning
Platforms / Deployment
Cloud / On-premise
Security & Compliance
Depends on configuration; Not publicly stated
Integrations & Ecosystem
- Databases
- APIs
- Infrastructure tools
Support & Community
Strong open-source community
#8 — IBM Data Management Console
Short description: IBM’s enterprise database monitoring solution offering performance analysis and optimization tools.
Key Features
- Database performance tracking
- Query optimization
- Resource monitoring
- Alerting system
- Analytics dashboard
Pros
- Strong enterprise capabilities
- Deep IBM integration
Cons
- IBM ecosystem dependency
- Complex setup
Platforms / Deployment
Cloud / On-premise
Security & Compliance
Enterprise encryption; Not publicly stated
Integrations & Ecosystem
- IBM Cloud
- Databases
- APIs
Support & Community
Enterprise support
#9 — SolarWinds Database Observability
Short description: A modern observability solution that extends database monitoring with AI-driven insights and cloud support.
Key Features
- AI performance analysis
- Query optimization
- Real-time alerts
- Cloud monitoring
- Historical trend analysis
Pros
- Strong AI insights
- Easy visualization
Cons
- Costly for SMBs
- Setup complexity
Platforms / Deployment
Cloud
Security & Compliance
Encryption; Not publicly stated
Integrations & Ecosystem
- Cloud platforms
- DevOps tools
- APIs
Support & Community
Strong enterprise support
#10 — Redgate SQL Monitor
Short description: A dedicated SQL Server monitoring tool focused on performance tracking, alerting, and optimization.
Key Features
- SQL Server monitoring
- Query performance tracking
- Alerting system
- Wait statistics analysis
- Dashboard reporting
Pros
- Excellent SQL Server focus
- Easy to use
Cons
- Limited to SQL Server
- Not suitable for multi-DB environments
Platforms / Deployment
Windows / Cloud
Security & Compliance
Encryption; Not publicly stated
Integrations & Ecosystem
- SQL Server ecosystem
- DevOps tools
- APIs
Support & Community
Strong Microsoft ecosystem support
Comparison Table (Top 10)
| Tool Name | Best For | Platform(s) Supported | Deployment | Standout Feature | Public Rating |
|---|---|---|---|---|---|
| SolarWinds DPA | Enterprise DB tuning | Multi | Cloud/On-prem | Query analysis | N/A |
| Datadog | Cloud observability | Multi | Cloud | AI monitoring | N/A |
| Dynatrace | AI monitoring | Multi | Cloud | RCA automation | N/A |
| New Relic | App + DB monitoring | Multi | Cloud | Full observability | N/A |
| Prometheus + Grafana | Open-source stacks | Multi | Cloud/On-prem | Custom dashboards | N/A |
| ManageEngine | IT monitoring suite | Multi | Cloud/On-prem | All-in-one tool | N/A |
| Zabbix | Open-source monitoring | Multi | Cloud/On-prem | Scalability | N/A |
| IBM Console | Enterprise DB | Multi | Cloud/On-prem | IBM integration | N/A |
| SolarWinds Observability | AI monitoring | Multi | Cloud | Predictive insights | N/A |
| Redgate SQL Monitor | SQL Server | Windows | Cloud/On-prem | SQL optimization | N/A |
Evaluation & Scoring of Database Monitoring Tools
| Tool Name | Core (25%) | Ease (15%) | Integrations (15%) | Security (10%) | Performance (10%) | Support (10%) | Value (15%) | Weighted Total (0–10) |
|---|---|---|---|---|---|---|---|---|
| SolarWinds DPA | 9 | 7 | 9 | 9 | 9 | 9 | 7 | 8.4 |
| Datadog | 9 | 8 | 10 | 9 | 9 | 9 | 7 | 8.6 |
| Dynatrace | 9 | 7 | 10 | 9 | 9 | 9 | 6 | 8.3 |
| New Relic | 8 | 9 | 9 | 8 | 8 | 8 | 7 | 8.1 |
| Prometheus + Grafana | 8 | 6 | 9 | 8 | 8 | 8 | 10 | 8.0 |
| ManageEngine | 8 | 8 | 8 | 8 | 8 | 8 | 8 | 8.0 |
| Zabbix | 8 | 6 | 8 | 8 | 8 | 8 | 10 | 7.9 |
| IBM Console | 9 | 6 | 9 | 10 | 9 | 9 | 6 | 8.3 |
| SolarWinds Obs | 9 | 8 | 9 | 9 | 9 | 9 | 7 | 8.5 |
| Redgate SQL Monitor | 8 | 9 | 7 | 8 | 8 | 8 | 8 | 8.0 |
Which Database Monitoring Tool Is Right for You?
Solo / Freelancer
Use lightweight open-source tools like Zabbix or Prometheus
SMB
ManageEngine or Redgate SQL Monitor for simplicity
Mid-Market
Datadog or New Relic for balanced observability
Enterprise
Dynatrace, SolarWinds, IBM tools for full-scale monitoring
Budget vs Premium
- Budget → Open-source tools
- Premium → AI-powered enterprise platforms
Feature Depth vs Ease of Use
- Advanced tools → Deep insights but complex
- Simple tools → Faster setup but limited analytics
Integrations & Scalability
Choose tools that integrate with cloud, DevOps, and SIEM systems
Security & Compliance Needs
Highly regulated industries need audit logs and anomaly detection
Frequently Asked Questions (FAQs)
1. What are Database Monitoring Tools?
They are platforms that track database performance, health, and activity in real time.
2. Why are they important?
They help prevent downtime and optimize database performance.
3. What do they monitor?
They monitor queries, CPU usage, memory, latency, and errors.
4. Are they cloud compatible?
Yes, most modern tools support cloud databases.
5. Do they use AI?
Yes, many tools use AI for anomaly detection and insights.
6. Can they detect slow queries?
Yes, query performance monitoring is a core feature.
7. Are open-source tools reliable?
Yes, but they require setup and maintenance.
8. Do they support multiple databases?
Most enterprise tools support SQL and NoSQL databases.
9. Can they integrate with DevOps tools?
Yes, many integrate with CI/CD and observability platforms.
10. Do they affect database performance?
Optimized tools have minimal performance overhead.
Conclusion
Database Monitoring Tools are essential for ensuring high performance, reliability, and availability of modern applications. As businesses move toward cloud-native and distributed systems, real-time visibility into database health has become critical. Modern tools combine AI, automation, and observability to detect issues before they impact users. From open-source solutions like Prometheus to enterprise platforms like Dynatrace and Datadog, organizations have a wide range of choices depending on scale and complexity. The right tool depends on your environment—cloud-first teams benefit from SaaS observability platforms, while enterprises may require deeper customization and AI-driven insights. Ultimately, the goal is to ensure faster query performance, zero downtime, and proactive issue resolution.