Introduction
GPU Observability and Profiling Tools are specialized software suites designed to monitor, analyze, and optimize the performance of Graphics Processing Units. In the current era of generative AI, large language models (LLMs), and complex physical simulations, the GPU has moved from being a peripheral graphics card to the central engine of the modern data center. These tools allow developers, ML engineers, and IT administrators to “look under the hood” of the hardware to understand how memory is allocated, identify bottlenecks in compute kernels, and monitor power consumption. Without these tools, the massive computational power of modern GPUs often remains underutilized, leading to wasted energy and increased operational costs.
The significance of these platforms today lies in their ability to bridge the gap between high-level code (like Python or C++) and the raw silicon. As GPU clusters grow in size and complexity—often involving hundreds of interconnected H100 or B200 units—observability becomes a critical requirement for maintaining system uptime and training efficiency. These tools provide the necessary data to perform “performance tuning,” which can reduce AI training times from weeks to days, directly impacting the speed of innovation and the bottom line of technology-driven enterprises.
Real-world use cases include:
- LLM Training Optimization: Identifying “stalls” in data loading that prevent the GPU from reaching peak utilization during model training.
- Gaming Engine Debugging: Profiling frame render times to identify specific shaders that cause latency or visual stuttering.
- HPC Resource Management: Monitoring temperature and power draw across a massive supercomputing cluster to prevent hardware failure.
- Crypto-Infrastructure Monitoring: Tracking the efficiency and “hash rate” of distributed GPU networks.
- Cloud Cost Management: Identifying idle GPU instances in a cloud environment to reduce unnecessary billing.
What buyers should evaluate:
- Vendor Compatibility: Does the tool support NVIDIA (CUDA), AMD (ROCm), Intel (oneAPI), or Apple (Metal)?
- Real-time vs. Post-mortem: Can you monitor live metrics, or is the tool built for deep-dive analysis of recorded traces?
- Overhead Impact: How much does the profiling tool itself slow down the application being measured?
- Granularity of Metrics: Does it track basic load percentages, or can it dive into warp occupancy and instruction-level latency?
- Multi-GPU/Cluster Support: Is the tool designed for a single workstation or a distributed data center environment?
- Ease of Integration: Does it plug into existing observability stacks like Prometheus, Grafana, or weights & biases (W&B)?
- Security & Access Control: Does it support Role-Based Access Control (RBAC) for sensitive enterprise environments?
- Cost of Ownership: Is it a free vendor-provided utility or a high-end enterprise license with a support contract?
Mandatory paragraph
- Best for: Machine Learning Engineers, DevOps professionals managing GPU clusters, Game Developers, and High-Performance Computing (HPC) researchers who need to maximize hardware efficiency.
- Not ideal for: General software developers who do not utilize GPU acceleration, or casual users who only use GPUs for basic display tasks.
Key Trends in GPU Observability & Profiling Tools
- Integration with MLOps Life Cycles: Profiling is moving from a manual “debug” step to an automated part of the CI/CD pipeline for AI models.
- E-BPF for GPU Monitoring: Emerging techniques are using eBPF-like approaches to monitor GPU kernel calls with near-zero overhead.
- Focus on Energy Sovereignty: Modern tools are placing a heavy emphasis on “performance-per-watt” to help organizations meet sustainability goals.
- Interconnect Observability: Profiling is shifting focus from the individual GPU to the “fabric” (NVLink/InfiniBand) that connects them.
- AI-Guided Optimization: Tools are beginning to use AI to suggest specific code changes (like kernel fusion) to resolve identified bottlenecks.
- Unified Profiling Across Vendors: A push toward cross-vendor standards (like the UXL Foundation) to monitor AMD, Intel, and NVIDIA hardware in one dashboard.
- Real-time Anomaly Detection: Using machine learning to flag “silent errors” or hardware degradation before a catastrophic failure occurs in a cluster.
- Kubernetes-Native Monitoring: The rise of “GPU Operators” that automatically expose GPU metrics to Prometheus in containerized environments.
How We Selected These Tools (Methodology)
The selection of the top GPU observability and profiling tools is based on a rigorous evaluation of the professional hardware landscape. Our methodology focuses on:
- Industry Standard Adoption: We prioritized tools that are the “default” choice for major hardware vendors and research institutions.
- Feature Completeness: Evaluation was based on the ability to track memory, compute, power, and interconnect metrics simultaneously.
- Performance Impact: Preference was given to tools that offer high-fidelity data with minimal “observer effect” on the application.
- Ecosystem Integration: We assessed how well these tools connect with standard data science and DevOps stacks (e.g., PyTorch, Grafana).
- Versatility: The list includes tools for deep-dive performance tuning as well as high-level cluster health monitoring.
- Reliability: Preference for tools with established support for the latest generations of hardware (NVIDIA Blackwell, AMD CDNA 3).
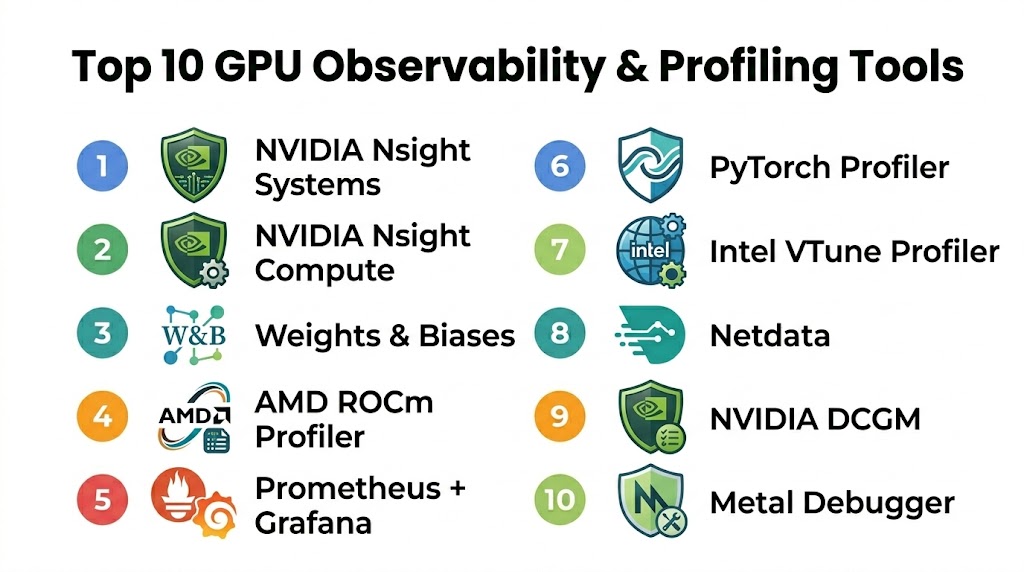
Top 10 GPU Observability & Profiling Tools
#1 — NVIDIA Nsight Systems
NVIDIA Nsight Systems is the flagship profiling tool for developers looking to optimize applications across CPUs and GPUs. It provides a unified timeline view that shows how the application interacts with the driver, the CUDA runtime, and the hardware itself. It is the gold standard for identifying system-wide bottlenecks and unearthing synchronization issues in multi-GPU setups.
Key Features
- System-Wide Timeline: Visualizes CPU and GPU activity on a single, synchronized timeline.
- NVLink & NVSwitch Monitoring: Tracks data movement across the high-speed interconnects.
- CUDA Kernel Analysis: Identifies long-running or inefficient GPU kernels.
- Deep OS Integration: Captures OS events, thread state, and library calls.
- Multi-Node Support: Capable of profiling applications running across a distributed cluster.
Pros
- Unmatched depth for NVIDIA-specific hardware features.
- Critical for identifying “gaps” in GPU execution where the hardware sits idle.
- Highly detailed visualization that makes complex threading issues obvious.
Cons
- Restricted strictly to NVIDIA hardware.
- The amount of data collected can be overwhelming for beginners.
Platforms / Deployment
- Windows / Linux
- Standalone Application / CLI
Security & Compliance
- Secure data collection via encrypted local or remote agents.
- RBAC support for remote profiling.
Integrations & Ecosystem
Nsight Systems is the core of the NVIDIA developer ecosystem.
- PyTorch / TensorFlow integration
- Integration with NVIDIA Nsight Compute for deep-dive kernel analysis
- CUDA Toolkit native support
Support & Community
Professional support via NVIDIA Developer programs and an extensive library of “Best Practices” documentation.
#2 — Weights & Biases (W&B)
Weights & Biases is the leading MLOps platform that has become the “system of record” for machine learning teams. While it is a broader platform, its GPU monitoring capabilities are essential for ML engineers who need to see GPU utilization and memory usage side-by-side with their model’s training accuracy and loss curves.
Key Features
- Integrated Dashboards: View GPU metrics (utilization, temp, memory) alongside training logs.
- System Metrics Tracking: Automatically captures hardware data without requiring extra code.
- Alerting System: Set triggers to notify the team if a GPU crashes or runs out of memory (OOM).
- Multi-User Collaboration: Share profiling reports across the entire engineering team.
- Artifact Versioning: Link GPU performance data to specific model versions.
Pros
- The easiest tool to integrate into a Python-based ML workflow.
- Provides high-level “observability” rather than just “profiling.”
- Excellent for long-running training jobs where you need to monitor health over days.
Cons
- Not designed for instruction-level hardware debugging.
- Requires a cloud subscription for the full collaborative feature set.
Platforms / Deployment
- Cloud / Self-hosted / Local
- Python Library / Web Dashboard
Security & Compliance
- SOC 2 Type II compliant and GDPR ready.
- Private Cloud options for sensitive data.
Integrations & Ecosystem
W&B is the “hub” for modern AI development.
- PyTorch / Keras / Hugging Face
- Kubernetes / SLURM
- Amazon SageMaker / Google Vertex AI
Support & Community
Massive community of ML practitioners and highly responsive technical support.
#3 — AMD ROCm Profiler (rocprof)
The ROCm Profiler is the primary tool for developers working on AMD Instinct and Radeon GPUs. As the industry looks for alternatives to CUDA, the ROCm toolchain has become essential for those porting AI workloads to AMD hardware. It provides a robust set of counters for hardware performance and memory bandwidth.
Key Features
- Hardware Counters: Provides deep access to AMD-specific compute unit (CU) metrics.
- Kernel Tracing: Records the execution time and arguments of every GPU kernel.
- Memory Bandwidth Analysis: Tracks HBM (High Bandwidth Memory) utilization.
- Cross-Platform CLI: Designed for high-performance Linux server environments.
- Integration with Omniperf: Works with AMD’s advanced performance analysis tool for deeper insights.
Pros
- Essential for optimizing workloads on AMD Instinct (MI300X) clusters.
- Open-source philosophy aligned with the broader ROCm ecosystem.
- Low overhead for large-scale performance tracing.
Cons
- Documentation and community support are less mature than NVIDIA’s.
- Limited support for Windows-based development.
Platforms / Deployment
- Linux
- CLI / Integration API
Security & Compliance
- Standard Linux security protocols.
- Open-source transparency for security audits.
Integrations & Ecosystem
The ROCm Profiler is a core component of the AMD AI software stack.
- PyTorch (ROCm version)
- AMD Omniperf / Omnitrace
- Slurm cluster management
Support & Community
Growing community support via GitHub and AMD’s professional Instinct support tiers.
#4 — Prometheus + Grafana (GPU Exporter)
For DevOps and SRE teams, the combination of Prometheus and Grafana—using the NVIDIA GPU Exporter or DCGM Exporter—is the industry standard for cluster-wide GPU observability. It allows teams to build “Single Pane of Glass” dashboards that monitor thousands of GPUs in real-time.
Key Features
- Real-time Monitoring: Tracks thousands of metrics across a cluster with sub-second latency.
- Custom Dashboards: Build highly visual, shareable Grafana dashboards.
- DCGM Integration: Directly leverages NVIDIA’s Data Center GPU Manager for hardware health.
- Alertmanager Support: Route GPU alerts to Slack, PagerDuty, or email.
- Historical Data Retention: Analyze GPU usage trends over weeks or months.
Pros
- The definitive solution for “Infrastructure-level” GPU observability.
- Highly scalable and works across hybrid cloud environments.
- Massive library of pre-built community dashboards.
Cons
- Requires significant setup and infrastructure management.
- Not a “profiler”; you cannot see individual code lines or kernel instructions.
Platforms / Deployment
- Kubernetes / Linux / Cloud
- Self-hosted / Managed Service
Security & Compliance
- Supports TLS, MFA, and RBAC via Grafana.
- Standard enterprise-grade observability security.
Integrations & Ecosystem
Prometheus/Grafana is the center of the modern DevOps stack.
- Kubernetes / Helm
- NVIDIA Data Center GPU Manager (DCGM)
- Amazon Managed Prometheus / Azure Monitor
Support & Community
The largest observability community in the world with endless documentation and plugins.
#5 — PyTorch Profiler
The PyTorch Profiler is a built-in tool within the PyTorch framework that allows ML engineers to profile their models without leaving the Python ecosystem. It provides an “execution-centric” view, showing how the CPU and GPU work together to execute a specific model architecture.
Key Features
- Execution Graph Visualization: Shows how operators like
Conv2dtranslate to GPU kernels. - Memory Timeline: Tracks memory allocation and identifies leaks or “spikes.”
- TensorBoard Integration: Export profiling data directly to the TensorBoard dashboard.
- Kineto Integration: Leverages the Kineto library for low-overhead hardware tracing.
- Automatic Recommendations: Suggests improvements like using “Distributed Data Parallel” (DDP).
Pros
- Zero setup required; it’s already in your PyTorch installation.
- Bridges the gap between “Machine Learning code” and “GPU hardware.”
- Excellent for identifying Python-side overhead that slows down the GPU.
Cons
- Limited to the PyTorch ecosystem.
- Does not provide the deep hardware-counter detail of Nsight Compute.
Platforms / Deployment
- Windows / Linux / macOS
- Python Library / TensorBoard
Security & Compliance
- Standard Python environment security.
- Data remains local unless exported to a cloud dashboard.
Integrations & Ecosystem
PyTorch Profiler is a native part of the most popular AI framework.
- TensorBoard
- Weights & Biases
- NVIDIA Kineto
Support & Community
Massive community support via PyTorch forums and GitHub.
#6 — NVIDIA Nsight Compute
While Nsight Systems is for “The Big Picture,” Nsight Compute is for “The Microscopic Detail.” It is an interactive kernel profiler that provides detailed performance metrics and API debugging for CUDA applications. It helps developers understand exactly why a single GPU kernel is underperforming.
Key Features
- Interactive Profiling: Allows for real-time debugging and step-through of GPU code.
- Roofline Analysis: Visualizes kernel performance against the theoretical hardware limits.
- Memory Workload Analysis: Detailed breakdown of cache hits, misses, and memory throughput.
- Instruction Level Profiling: See exactly which lines of CUDA C++ are causing delays.
- Baseline Comparison: Compare two versions of a kernel side-by-side to see optimization impact.
Pros
- The most powerful tool for deep-dive optimization of CUDA kernels.
- Provides “Guided Analysis” that tells you exactly how to fix a performance issue.
- Unmatched for performance engineers writing custom CUDA kernels.
Cons
- High overhead; it can significantly slow down the application during profiling.
- Requires deep knowledge of GPU architecture to use effectively.
Platforms / Deployment
- Windows / Linux
- Standalone Application / CLI
Security & Compliance
- Standard NVIDIA security protocols.
- Remote profiling via SSH with encrypted data transfer.
Integrations & Ecosystem
Works in tandem with Nsight Systems for a complete optimization workflow.
- CUDA Toolkit
- Visual Studio integration
- NVIDIA Nsight Graphics
Support & Community
Premier support for enterprise CUDA developers.
#7 — Intel® VTune™ Profiler
Intel® VTune™ Profiler is a world-class performance analysis tool that has expanded to support Intel’s “discrete” GPUs (Data Center GPU Max and Arc). It is the primary tool for developers using the oneAPI standard to write code that runs across CPUs, GPUs, and FPGAs.
Key Features
- Offload Analysis: Identifies which parts of your code should be moved to the GPU.
- GPU Compute/Media Hotspots: Visualizes hotspots in GPU kernels and media pipelines.
- oneAPI Support: Native profiling for DPC++ (Data Parallel C++).
- System-Wide Profiling: Analyzes the interaction between Intel CPUs and GPUs.
- Microarchitecture Exploration: Deep insights into Intel’s X-core performance.
Pros
- The definitive tool for developers in the Intel oneAPI ecosystem.
- Excellent at identifying data transfer bottlenecks between host and device.
- Polished, enterprise-grade interface.
Cons
- Support for non-Intel GPUs is limited or non-existent.
- Requires a learning curve to understand Intel’s specific terminology.
Platforms / Deployment
- Windows / Linux
- Standalone Application / Web Server / CLI
Security & Compliance
- Enterprise-grade data security.
- Regular security updates from Intel.
Integrations & Ecosystem
VTune is a pillar of the Intel developer software suite.
- Intel oneAPI Base Toolkit
- Microsoft Visual Studio
- Eclipse integration
Support & Community
High-level professional support and a strong presence in the enterprise HPC community.
#8 — Netdata (GPU Plugin)
Netdata is a real-time, low-latency observability tool that specializes in high-fidelity infrastructure monitoring. Its GPU plugins provide instant, per-second monitoring of NVIDIA hardware without the complexity of setting up a full Prometheus stack.
Key Features
- Per-Second Granularity: Tracks GPU metrics with higher frequency than traditional exporters.
- Zero-Configuration: Automatically detects GPUs and starts monitoring upon installation.
- Interactive Web Dashboards: Clean, responsive visualizations out of the box.
- Smart Alerts: Pre-configured health checks for GPU temperature and memory usage.
- Low Resource Overhead: Designed to run on the node without impacting performance.
Pros
- The fastest “time-to-value” for basic GPU health monitoring.
- Beautiful, modern interface that is easy for non-specialists to read.
- Completely free for local monitoring.
Cons
- Not a “profiler”; you cannot analyze code or individual kernels.
- Cloud-based collaboration requires a paid “Netdata Cloud” subscription.
Platforms / Deployment
- Linux / Docker / macOS / Cloud
- Local Agent / Web Dashboard
Security & Compliance
- Data stays on-prem by default.
- TLS and stream encryption for cloud sync.
Integrations & Ecosystem
Netdata integrates with 800+ other infrastructure tools.
- Slack / PagerDuty / Discord for alerts
- Prometheus (as a data source)
- Grafana
Support & Community
Very active community and high-quality “real-time” support via their community site.
#9 — NVIDIA DCGM (Data Center GPU Manager)
DCGM is a suite of tools for managing and monitoring NVIDIA GPUs in cluster environments. It is the “under-the-hood” engine that powers most other enterprise monitoring tools, providing access to hardware health, diagnostics, and performance policies.
Key Features
- Health Monitoring: Identifies failing memory, thermal issues, and PCIe errors.
- NVIDIA NVLink Metrics: Detailed tracking of interconnect traffic and errors.
- Configuration Management: Set and enforce power limits and clock speeds across a cluster.
- On-Demand Diagnostics: Run stress tests to verify hardware stability.
- Standard Integration: Exposes metrics via the DCGM Exporter for Prometheus.
Pros
- The foundational source of truth for NVIDIA GPU health.
- Critical for “Fleet Management” in a large data center.
- Highly reliable and optimized for low-impact monitoring.
Cons
- Primarily a CLI/API tool; requires a front-end like Grafana for visualization.
- Limited to the Linux operating system for most data center features.
Platforms / Deployment
- Linux
- CLI / API / Prometheus Exporter
Security & Compliance
- Enterprise-grade hardware security integration.
- Secure daemon communication.
Integrations & Ecosystem
DCGM is the interface between NVIDIA hardware and the world of DevOps.
- Kubernetes / SLURM
- Prometheus / Grafana
- Bright Computing
Support & Community
Premier support for enterprise AI and HPC customers.
#10 — Metal Debugger & Profiler (Apple)
For developers in the Apple ecosystem (macOS/iOS), the Metal Debugger and Profiler (built into Xcode) is the essential tool for optimizing GPU workloads on Apple Silicon (M1/M2/M3). It is critical for game developers and ML engineers using Core ML.
Key Features
- GPU Frame Capture: Capture and “replay” a frame to analyze rendering bottlenecks.
- Shader Debugging: Step through Metal Shading Language (MSL) code line-by-line.
- Memory Footprint Tool: Detailed breakdown of textures, buffers, and heap usage.
- Apple Silicon Insights: Specific metrics for the unified memory architecture.
- Dependency Graph: Visualizes how different GPU commands interact and overlap.
Pros
- Deeply optimized for the unique unified memory architecture of Apple Silicon.
- Seamlessly integrated into the Xcode development environment.
- Exceptional visualization of the graphics pipeline.
Cons
- Strictly limited to the Apple ecosystem.
- Primarily focused on graphics; ML-specific profiling features are still maturing.
Platforms / Deployment
- macOS
- Xcode Integration
Security & Compliance
- Backed by Apple’s stringent platform security.
- Sandboxed development environment.
Integrations & Ecosystem
The definitive tool for anyone developing for iPhone, iPad, or Mac.
- Xcode / Core ML / PyTorch (MPS backend)
- Unity / Unreal Engine (Metal backend)
- Swift / C++
Support & Community
Professional support via Apple Developer programs and a large community of iOS/macOS developers.
Comparison Table (Top 10)
| Tool Name | Best For | Platform(s) Supported | Deployment | Standout Feature |
|---|---|---|---|---|
| NVIDIA Nsight Systems | System-wide Bottlenecks | Windows, Linux | Standalone App | Unified CPU/GPU Timeline |
| Weights & Biases | ML Observability | Cloud, Self-hosted | Web Dashboard | Training Logs + GPU Metrics |
| AMD ROCm Profiler | AMD Clusters | Linux | CLI | Deep CDNA 3 Metrics |
| Prometheus + Grafana | Data Center Ops | K8s, Linux | Self-hosted | Cluster-wide Dashboarding |
| PyTorch Profiler | ML Developers | Win, Mac, Linux | Python Library | Operator-to-Kernel Mapping |
| NVIDIA Nsight Compute | Kernel Optimization | Windows, Linux | Standalone App | Roofline Analysis |
| Intel® VTune™ | Intel oneAPI Ops | Windows, Linux | Standalone App | Offload Analysis |
| Netdata | Real-time Health | Linux, Docker | Web Dashboard | 1-Second Granularity |
| NVIDIA DCGM | Fleet Management | Linux | CLI / API | Hardware Diagnostics |
| Metal Debugger | Apple Silicon Ops | macOS | Xcode | Unified Memory Insights |
Export to Sheets
Evaluation & Scoring of GPU Observability & Profiling Tools
| Tool Name | Core (25%) | Ease (15%) | Integrations (15%) | Security (10%) | Performance (10%) | Support (10%) | Value (15%) | Weighted Total |
|---|---|---|---|---|---|---|---|---|
| Nsight Systems | 10 | 7 | 9 | 9 | 9 | 10 | 10 | 9.1 |
| W&B | 8 | 10 | 10 | 10 | 10 | 9 | 8 | 9.1 |
| ROCm Profiler | 9 | 6 | 8 | 8 | 9 | 8 | 9 | 8.1 |
| Prom + Grafana | 9 | 5 | 10 | 10 | 10 | 10 | 10 | 8.8 |
| PyTorch Profiler | 8 | 10 | 10 | 9 | 8 | 9 | 10 | 9.0 |
| Nsight Compute | 10 | 5 | 8 | 9 | 6 | 10 | 10 | 8.5 |
| VTune Profiler | 9 | 7 | 8 | 9 | 8 | 9 | 9 | 8.4 |
| Netdata | 7 | 10 | 8 | 9 | 10 | 8 | 10 | 8.4 |
| NVIDIA DCGM | 10 | 6 | 9 | 10 | 10 | 10 | 10 | 9.1 |
| Metal Debugger | 9 | 8 | 8 | 9 | 9 | 9 | 10 | 8.8 |
Export to Sheets
How to Interpret the Scores
The scoring model above is designed to provide a comparative look at how these tools perform for their specific target audiences. A high Core (25%) score reflects the depth of hardware counters and raw profiling power. The Weighted Total indicates the overall excellence of the tool in its respective category. For example, NVIDIA Nsight Systems and DCGM lead for pure performance engineering and fleet management, while Weights & Biases and PyTorch Profiler lead for developer ease of use and ML workflow integration.
When using this table, prioritize the columns that match your role. If you are an SRE, the Integrations and Security columns are your most important metrics. If you are a CUDA developer writing custom kernels, the Core power and Support quality of Nsight Compute are your primary drivers. The weighted total is a global benchmark, but your individual “best fit” may depend on the specific hardware vendor you are using (NVIDIA vs. AMD vs. Intel).
Which GPU Observability & Profiling Tool Is Right for You?
For Machine Learning Engineers
If you spend your day in PyTorch or TensorFlow, start with the PyTorch Profiler. It is already integrated into your workflow and will help you catch 80% of common bottlenecks (like data loading stalls). For long-term project management and team collaboration, Weights & Biases is the essential dashboard for tracking your fleet’s health during training.
For CUDA / C++ Performance Engineers
When you need to squeeze the absolute maximum performance out of a single kernel, NVIDIA Nsight Compute is your tool of choice. To understand how that kernel fits into the larger system and to identify “idle time” caused by CPU-GPU synchronization, NVIDIA Nsight Systems is the indispensable companion.
For Data Center SREs & DevOps
If you are managing a cluster of GPUs in Kubernetes, the combination of NVIDIA DCGM and a Prometheus + Grafana stack is non-negotiable. It provides the high-level health monitoring and alerting needed to ensure 99.9% uptime for your AI infrastructure.
For Cross-Vendor (Intel/AMD) Environments
If you are porting code to AMD hardware, you must master the ROCm Profiler. For those working in the Intel ecosystem or looking to use the oneAPI standard for cross-platform compute, Intel VTune Profiler offers the most professional and integrated experience.
Budget vs Premium
- Budget: Netdata and Google Family Link (for Android users) offer free, high-quality monitoring. uBlock Origin (while not a GPU tool) is a reminder that the best open-source tools (like PyTorch Profiler) are often free.
- Premium: Weights & Biases and Aura (for security) represent the premium end where you pay for team collaboration, historical data retention, and enterprise support.
Frequently Asked Questions (FAQs)
1. What is the difference between observability and profiling?
Observability is about “Health and Status”—it answers the question, “Is my GPU cluster working correctly, and what is the current utilization?” Profiling is about “Performance and Detail”—it answers the question, “Why is my code slow, and which specific line of instructions is causing a bottleneck?”
2. Can I use these tools on cloud instances (AWS/Azure)?
Yes, most of these tools work on cloud-based GPU instances. However, you often need to ensure that the proper drivers and “profiling permissions” are enabled on the VM. Tools like Weights & Biases are specifically designed to aggregate data from cloud instances into a centralized web view.
3. How much overhead do these profilers add?
It varies. Infrastructure monitors like DCGM or Netdata add less than 1% overhead. Application profilers like Nsight Systems add 5-15% overhead. Deep kernel profilers like Nsight Compute can slow down your application by 10x or more because they are replaying instructions to collect hardware counters.
4. Can I monitor AMD and NVIDIA GPUs in the same dashboard?
Yes, using a Prometheus + Grafana stack. You would use the NVIDIA DCGM Exporter for your NVIDIA nodes and the ROCm Exporter for your AMD nodes. Grafana can then aggregate both data sources into a single, unified view.
5. What are “GPU Hardware Counters”?
These are physical registers on the GPU chip that track events like “Clock cycles,” “Memory transactions,” “Warp instructions,” and “Cache hits.” Profiling tools read these counters to give you a precise mathematical picture of how the hardware is behaving.
6. Why is GPU memory usage different from CPU memory usage?
GPUs use specialized, high-bandwidth memory (HBM or GDDR). Unlike CPU RAM, GPU memory is managed in “pools” by the AI framework (like PyTorch). Profiling tools are necessary to see the difference between “Reserved” memory (what the framework took) and “Allocated” memory (what your model is actually using).
7. Do these tools help with “Out of Memory” (OOM) errors?
Yes. Tools like PyTorch Profiler and Nsight Systems provide a memory timeline that shows exactly when and where the memory spike occurred, allowing you to identify the specific tensor or layer that caused the crash.
8. Can I profile GPUs on a Mac?
Yes, but you are limited to Apple Silicon (M1/M2/M3) using the Metal Debugger and Xcode. While you can run PyTorch on a Mac using the mps backend, the deep hardware-level profiling is done through Apple’s native developer tools.
9. What is “GPU Utilization”?
Utilization is a high-level metric showing the percentage of time the GPU was busy during a specific window. However, “100% utilization” does not always mean your code is fast; it just means the GPU was doing something. Profiling is needed to ensure that “something” is efficient compute, not just waiting for data.
10. Is Nsight Systems free?
Yes, NVIDIA Nsight Systems and Nsight Compute are free to download and use as part of the NVIDIA Developer program. However, they are proprietary and only work with NVIDIA hardware.
Conclusion
GPU Observability and Profiling are no longer optional “add-ons” in the age of AI-driven computing; they are the fundamental tools that ensure your multi-million dollar hardware investments are actually delivering their promised value. Whether you are a single researcher tuning a PyTorch model or a DevOps team managing a global fleet of H100s, the right tool provides the visibility needed to move from “it works” to “it’s optimal.” As we look toward the next generation of GPU fabrics and unified memory architectures in 2026, mastering these tools will be the key differentiator between successful AI deployment and expensive hardware sprawl. Your next step should be to choose the tool that matches your hardware vendor (NVIDIA vs. AMD) and your specific role (ML Engineer vs. SRE) and start with a basic baseline profile of your most critical workload today.