Uploading every day but stuck at a few views?
Many creators guess: a shocked-face thumbnail, a “MUST WATCH” title, an upload at a random hour – and hope. A better way is to look at the data of channels that already work: how often they upload, which day and time their videos get the most views, and whether Shorts or long videos do better for them.
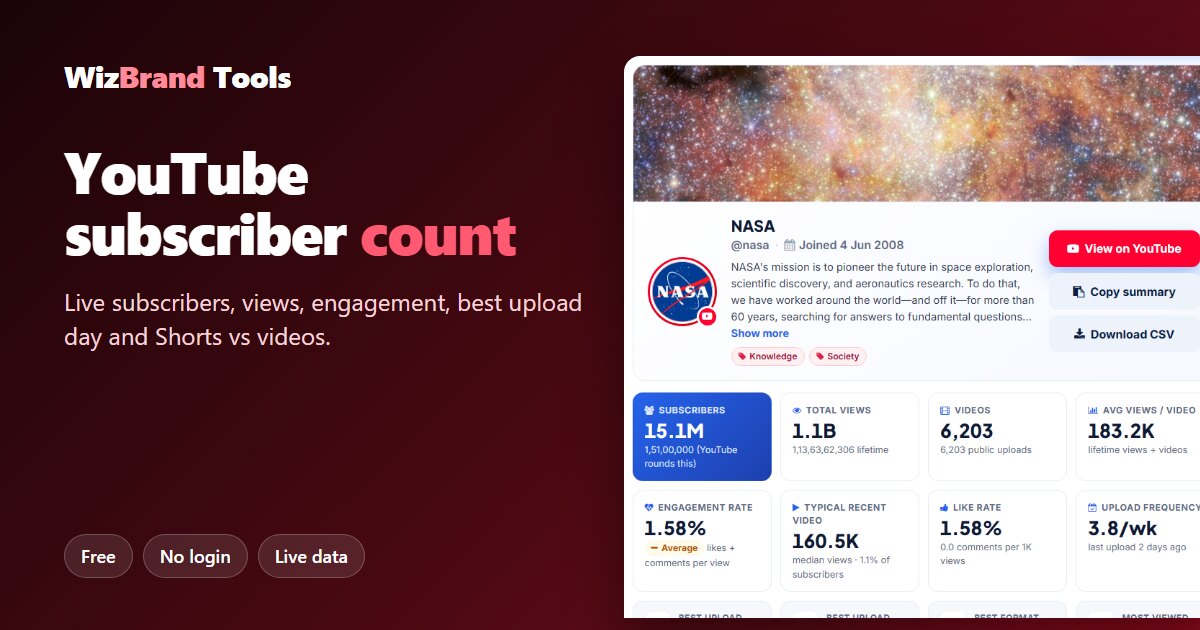
YouTube Studio shows this only for your own channel. The free YouTube Subscriber Count tool by WizBrand shows it for any public channel. Paste a channel link or @handle and in a few seconds you get the live subscriber count, total views and videos, plus a full report on the latest uploads: engagement rate, best upload day and time, Shorts vs videos, top videos and the tags the channel uses.
No login and no payment. The data comes straight from the official YouTube Data API. Below we show how it works with a real check of NASA’s YouTube channel.
What the YouTube subscriber count checker shows
| Metric | What it tells you |
|---|---|
| Subscribers | The live subscriber count (YouTube rounds it for most channels, and the tool shows exactly what YouTube publishes). |
| Total views and videos | Lifetime views, public uploads and average views per video. |
| Engagement rate | Likes and comments per view on recent uploads, graded Low to Excellent. |
| Typical recent video | The median views of recent uploads – what a normal new video really gets. |
| Upload frequency | Uploads per week and when the last one went up. |
| Best upload day and time | Which weekday and hour the channel’s uploads get the most views. |
| Shorts vs videos | How many of each the channel posts, and which gets more views. |
| Top videos and tags | The most viewed recent uploads and the keywords the channel uses. |
| Estimated earnings | A wide range based on typical ad rates – an estimate, not real income. |
| Export | Copy a summary or download every recent video’s stats as a CSV. |
How to check YouTube subscribers (3 easy steps)
Step 1: Paste the channel link or @handle
Open the YouTube Subscriber Count tool. Paste a channel link such as https://www.youtube.com/@NASA, type just the @handle, or paste a link to any video or Short from the channel.

Step 2: Click Show Analytics
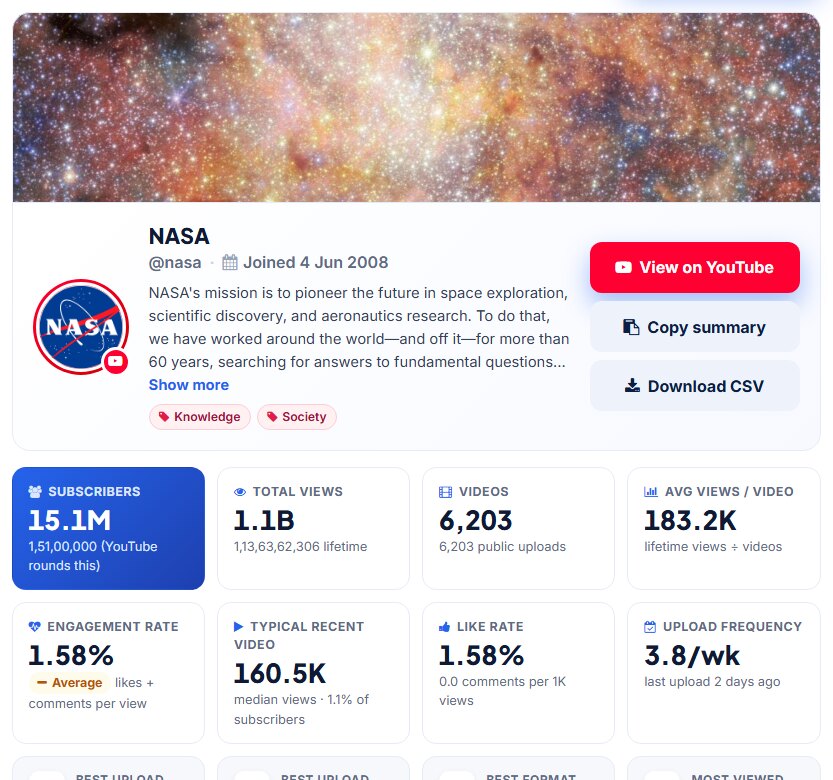
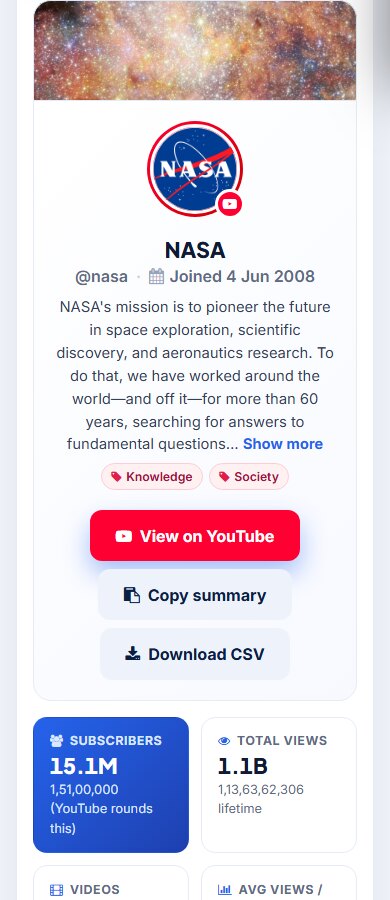
Click Show Analytics. The tool fetches the live channel stats and its latest uploads. In a few seconds you see the channel card, subscribers, views, videos and the key numbers.
Step 3: Read the full report
Below the numbers you get the best upload day, best upload time, best format and the most viewed recent upload.

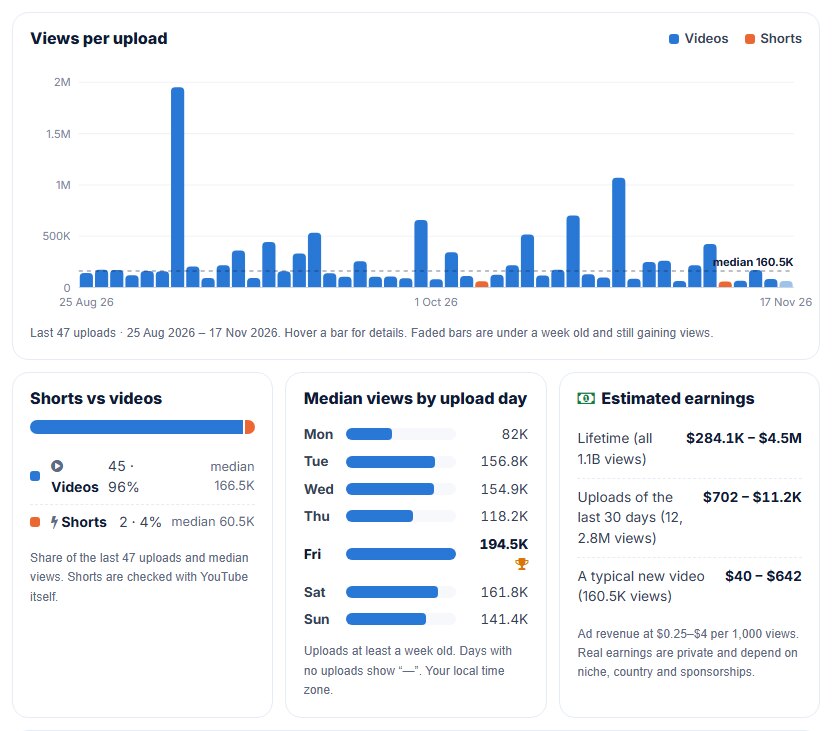
Then scroll for the charts: views of each recent upload, Shorts vs videos, median views by upload day and the estimated earnings range.
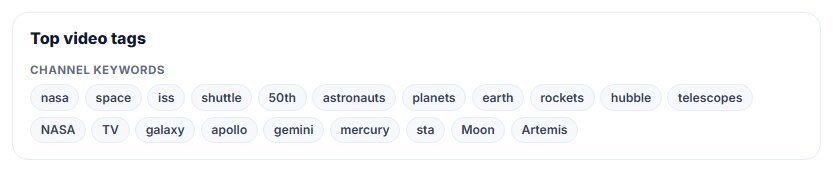
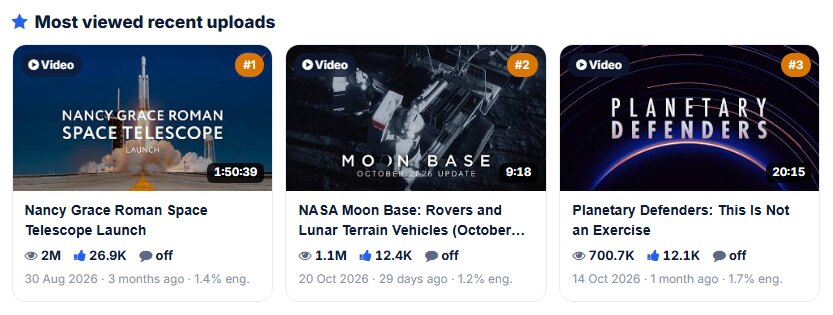
You also see the channel’s keywords and its most viewed recent uploads.
Real example: what we found for NASA on YouTube
We ran the tool on NASA’s public channel (@NASA) on 18 November 2026. These are the real results. The tool analysed the channel’s last 47 uploads, from 25 August to 17 November 2026.
| Metric | @NASA result |
|---|---|
| Subscribers | 15.1M (rounded by YouTube) |
| Total views | 1.1B (1,136,362,306) |
| Videos | 6,203 public uploads (joined 4 June 2008) |
| Average views per video (lifetime) | 183.2K |
| Typical recent video | 160.5K median views – about 1.1% of subscribers |
| Engagement rate | 1.58% (graded Average) |
| Upload frequency | 3.8 uploads per week |
| Best upload day | Friday – median 194.5K views (Monday lowest at 82K) |
| Best upload time | 5 PM – 6 PM (shown in the viewer’s local time; our check ran in India time, IST) |
| Shorts vs videos | 45 videos (median 166.5K views) vs 2 Shorts (median 60.5K) |
| Most viewed recent upload | 2M views – Nancy Grace Roman Space Telescope launch (30 Aug 2026) |
What these numbers mean
- Subscribers are not views. NASA has 15.1 million subscribers, but a typical new video gets about 160K views – roughly 1% of subscribers. That is why the “typical recent video” number tells you more than the subscriber count.
- The day matters. NASA’s Friday uploads got more than twice the median views of its Monday uploads (194.5K vs 82K). Every channel is different – check your own niche before choosing your day.
- Long videos win for this channel. NASA’s recent long videos had a median of 166.5K views, against 60.5K for its two Shorts. With only 2 Shorts that is a small sample, so treat it as a hint, not a rule.
- One big event lifts everything. The telescope launch stream reached 2M views, more than 12 times the typical video. Big live events and news moments pull in viewers.
- Engagement depends on settings too. NASA has comments turned off on these uploads, so its engagement rate counts likes only.
How the engagement rate is calculated
The tool adds the likes and comments of the channel’s recent uploads and divides by their views:
Engagement rate = (likes + comments) ÷ views × 100

| Engagement rate (per view) | Grade |
|---|---|
| Under 1.5% | Low |
| 1.5% – 3.5% | Average |
| 3.5% – 6% | High |
| Above 6% | Excellent |
Very large channels often score lower than small ones, because many casual viewers watch without liking. Compare channels of a similar size.
The best upload day compares the median views of uploads by weekday. Uploads less than a week old are left out, because they are still gaining views, and the median stops one viral video from deciding the result.
About the estimated earnings
YouTube earnings are private. The tool shows a wide range based on typical ad revenue of $0.25 to $4 per 1,000 views. For NASA that range was $284.1K – $4.5M lifetime – a very wide estimate, not a fact. Real income depends on the niche, viewers’ countries and sponsorships. Use it only as a rough idea.
Sort videos, copy the summary or download a CSV
Under the charts you get every recent upload with its views, likes and comments. Filter by Videos or Shorts and sort by Latest, Most viewed, Most liked or Most comments. Use Copy summary to paste the key numbers into a report, and Download CSV to open all videos in Excel or Google Sheets. Click Refresh data for the latest numbers.
Who should use a YouTube subscriber count checker?
- Small creators – learn from bigger channels in your niche: upload day, time, format and topics.
- Brands and marketers – check a YouTuber’s typical views and engagement before a sponsorship.
- Agencies – benchmark channels and export the data for client reports.
- Students and researchers – get quick public numbers for any channel.
Works on your phone too
Copy a channel link from the YouTube app, open the tool in your mobile browser and paste it – no app or login needed.
Tips to grow your YouTube channel with this data
- Study 3–5 channels in your niche, not only the biggest ones. Look for patterns in their best day, time and format.
- Test your upload day. Try the strongest day for a few weeks and compare your own results.
- Pick the format that works in your niche. If Shorts clearly beat long videos for similar channels, try more Shorts – and the other way round.
- Upload consistently. A rhythm you can keep beats bursts followed by silence.
- Use the right keywords. Check the tags of top channels for ideas, then write clear titles and descriptions.
- Learn from top videos. Look at what the most viewed uploads have in common: topic, length and title style.
- Grow real subscribers. Bought subscribers don’t watch, so they pull your views per subscriber down.
Frequently asked questions
Is the YouTube subscriber count checker free?
Yes. It is completely free and unlimited. No account, login or credit card is needed.
What can I enter?
A channel URL like https://www.youtube.com/@name, a channel ID link (youtube.com/channel/UC…), a bare @handle, or a link to any video or Short from the channel.
Is the subscriber count live?
Yes. The numbers are fetched from the YouTube Data API when you search. Click “Refresh data” for the latest numbers.
Why is the subscriber count rounded?
YouTube itself publishes rounded subscriber numbers for most channels (for example 15.1M), so the tool shows the same value.
How is the best upload day found?
The tool compares the median views of recent uploads by the weekday they were published, leaving out uploads less than a week old.
Are the earnings real?
No. Earnings are private. The tool shows a wide estimate based on typical ad rates of $0.25–$4 per 1,000 views.
Does the tool need my YouTube login?
No. It reads only public channel data, so you never connect your account and the channel owner is not notified.
Can I download the data?
Yes. Click “Download CSV” to save every recent video with its views, likes and comments, or “Copy summary” to copy the key numbers.
Conclusion: stop guessing, check the data
Subscribers are only the start. Views per video, engagement, the best upload day and the right format tell you what really works. As the NASA example shows, 15.1 million subscribers turn into about 160K views for a typical video, and the upload day can double the views.
Check any channel now with the free YouTube Subscriber Count checker. It is live, free and needs no login.
Check YouTube subscribers now →
More free social media tools
- Instagram Followers Count – followers, reels and engagement of any business or creator account
- X Follower Count – live followers, views and engagement rate
- Pinterest Followers Count – followers, saves and most saved pins
- Threads Followers Count – check Threads profiles
- Facebook Page Followers Count – page followers and post engagement
- Reddit Stats – subreddit members and top posts
Uploading every day but stuck at a few views?
Many creators guess: a shocked-face thumbnail, a “MUST WATCH” title, an upload at a random hour – and hope. A better way is to look at the data of channels that already work: how often they upload, which day and time their videos get the most views, and whether Shorts or long videos do better for them.
YouTube Studio shows this only for your own channel. The free YouTube Subscriber Count tool by WizBrand shows it for any public channel. Paste a channel link or @handle and in a few seconds you get the live subscriber count, total views and videos, plus a full report on the latest uploads: engagement rate, best upload day and time, Shorts vs videos, top videos and the tags the channel uses.
No login and no payment. The data comes straight from the official YouTube Data API. Below we show how it works with a real check of NASA’s YouTube channel.
What the YouTube subscriber count checker shows
| Metric | What it tells you |
|---|---|
| Subscribers | The live subscriber count (YouTube rounds it for most channels, and the tool shows exactly what YouTube publishes). |
| Total views and videos | Lifetime views, public uploads and average views per video. |
| Engagement rate | Likes and comments per view on recent uploads, graded Low to Excellent. |
| Typical recent video | The median views of recent uploads – what a normal new video really gets. |
| Upload frequency | Uploads per week and when the last one went up. |
| Best upload day and time | Which weekday and hour the channel’s uploads get the most views. |
| Shorts vs videos | How many of each the channel posts, and which gets more views. |
| Top videos and tags | The most viewed recent uploads and the keywords the channel uses. |
| Estimated earnings | A wide range based on typical ad rates – an estimate, not real income. |
| Export | Copy a summary or download every recent video’s stats as a CSV. |
How to check YouTube subscribers (3 easy steps)
Step 1: Paste the channel link or @handle
Open the YouTube Subscriber Count tool. Paste a channel link such as https://www.youtube.com/@NASA, type just the @handle, or paste a link to any video or Short from the channel.

Step 2: Click Show Analytics
Click Show Analytics. The tool fetches the live channel stats and its latest uploads. In a few seconds you see the channel card, subscribers, views, videos and the key numbers.

Step 3: Read the full report
Below the numbers you get the best upload day, best upload time, best format and the most viewed recent upload.

Then scroll for the charts: views of each recent upload, Shorts vs videos, median views by upload day and the estimated earnings range.

You also see the channel’s keywords and its most viewed recent uploads.


Real example: what we found for NASA on YouTube
We ran the tool on NASA’s public channel (@NASA) on 18 November 2026. These are the real results. The tool analysed the channel’s last 47 uploads, from 25 August to 17 November 2026.
| Metric | @NASA result |
|---|---|
| Subscribers | 15.1M (rounded by YouTube) |
| Total views | 1.1B (1,136,362,306) |
| Videos | 6,203 public uploads (joined 4 June 2008) |
| Average views per video (lifetime) | 183.2K |
| Typical recent video | 160.5K median views – about 1.1% of subscribers |
| Engagement rate | 1.58% (graded Average) |
| Upload frequency | 3.8 uploads per week |
| Best upload day | Friday – median 194.5K views (Monday lowest at 82K) |
| Best upload time | 5 PM – 6 PM (shown in the viewer’s local time; our check ran in India time, IST) |
| Shorts vs videos | 45 videos (median 166.5K views) vs 2 Shorts (median 60.5K) |
| Most viewed recent upload | 2M views – Nancy Grace Roman Space Telescope launch (30 Aug 2026) |
What these numbers mean
- Subscribers are not views. NASA has 15.1 million subscribers, but a typical new video gets about 160K views – roughly 1% of subscribers. That is why the “typical recent video” number tells you more than the subscriber count.
- The day matters. NASA’s Friday uploads got more than twice the median views of its Monday uploads (194.5K vs 82K). Every channel is different – check your own niche before choosing your day.
- Long videos win for this channel. NASA’s recent long videos had a median of 166.5K views, against 60.5K for its two Shorts. With only 2 Shorts that is a small sample, so treat it as a hint, not a rule.
- One big event lifts everything. The telescope launch stream reached 2M views, more than 12 times the typical video. Big live events and news moments pull in viewers.
- Engagement depends on settings too. NASA has comments turned off on these uploads, so its engagement rate counts likes only.
How the engagement rate is calculated
The tool adds the likes and comments of the channel’s recent uploads and divides by their views:
Engagement rate = (likes + comments) ÷ views × 100

| Engagement rate (per view) | Grade |
|---|---|
| Under 1.5% | Low |
| 1.5% – 3.5% | Average |
| 3.5% – 6% | High |
| Above 6% | Excellent |
Very large channels often score lower than small ones, because many casual viewers watch without liking. Compare channels of a similar size.
The best upload day compares the median views of uploads by weekday. Uploads less than a week old are left out, because they are still gaining views, and the median stops one viral video from deciding the result.
About the estimated earnings
YouTube earnings are private. The tool shows a wide range based on typical ad revenue of $0.25 to $4 per 1,000 views. For NASA that range was $284.1K – $4.5M lifetime – a very wide estimate, not a fact. Real income depends on the niche, viewers’ countries and sponsorships. Use it only as a rough idea.
Sort videos, copy the summary or download a CSV
Under the charts you get every recent upload with its views, likes and comments. Filter by Videos or Shorts and sort by Latest, Most viewed, Most liked or Most comments. Use Copy summary to paste the key numbers into a report, and Download CSV to open all videos in Excel or Google Sheets. Click Refresh data for the latest numbers.
Who should use a YouTube subscriber count checker?
- Small creators – learn from bigger channels in your niche: upload day, time, format and topics.
- Brands and marketers – check a YouTuber’s typical views and engagement before a sponsorship.
- Agencies – benchmark channels and export the data for client reports.
- Students and researchers – get quick public numbers for any channel.
Works on your phone too
Copy a channel link from the YouTube app, open the tool in your mobile browser and paste it – no app or login needed.

Tips to grow your YouTube channel with this data
- Study 3–5 channels in your niche, not only the biggest ones. Look for patterns in their best day, time and format.
- Test your upload day. Try the strongest day for a few weeks and compare your own results.
- Pick the format that works in your niche. If Shorts clearly beat long videos for similar channels, try more Shorts – and the other way round.
- Upload consistently. A rhythm you can keep beats bursts followed by silence.
- Use the right keywords. Check the tags of top channels for ideas, then write clear titles and descriptions.
- Learn from top videos. Look at what the most viewed uploads have in common: topic, length and title style.
- Grow real subscribers. Bought subscribers don’t watch, so they pull your views per subscriber down.
Frequently asked questions
Is the YouTube subscriber count checker free?
Yes. It is completely free and unlimited. No account, login or credit card is needed.
What can I enter?
A channel URL like https://www.youtube.com/@name, a channel ID link (youtube.com/channel/UC…), a bare @handle, or a link to any video or Short from the channel.
Is the subscriber count live?
Yes. The numbers are fetched from the YouTube Data API when you search. Click “Refresh data” for the latest numbers.
Why is the subscriber count rounded?
YouTube itself publishes rounded subscriber numbers for most channels (for example 15.1M), so the tool shows the same value.
How is the best upload day found?
The tool compares the median views of recent uploads by the weekday they were published, leaving out uploads less than a week old.
Are the earnings real?
No. Earnings are private. The tool shows a wide estimate based on typical ad rates of $0.25–$4 per 1,000 views.
Does the tool need my YouTube login?
No. It reads only public channel data, so you never connect your account and the channel owner is not notified.
Can I download the data?
Yes. Click “Download CSV” to save every recent video with its views, likes and comments, or “Copy summary” to copy the key numbers.
Conclusion: stop guessing, check the data
Subscribers are only the start. Views per video, engagement, the best upload day and the right format tell you what really works. As the NASA example shows, 15.1 million subscribers turn into about 160K views for a typical video, and the upload day can double the views.
Check any channel now with the free YouTube Subscriber Count checker. It is live, free and needs no login.
Check YouTube subscribers now →
More free social media tools
- Instagram Followers Count – followers, reels and engagement of any business or creator account
- X Follower Count – live followers, views and engagement rate
- Pinterest Followers Count – followers, saves and most saved pins
- Threads Followers Count – check Threads profiles
- Facebook Page Followers Count – page followers and post engagement
- Reddit Stats – subreddit members and top posts

Uploading every day but stuck at a few views?
Many creators guess: a shocked-face thumbnail, a “MUST WATCH” title, an upload at a random hour – and hope. A better way is to look at the data of channels that already work: how often they upload, which day and time their videos get the most views, and whether Shorts or long videos do better for them.
YouTube Studio shows this only for your own channel. The free YouTube Subscriber Count tool by WizBrand shows it for any public channel. Paste a channel link or @handle and in a few seconds you get the live subscriber count, total views and videos, plus a full report on the latest uploads: engagement rate, best upload day and time, Shorts vs videos, top videos and the tags the channel uses.
No login and no payment. The data comes straight from the official YouTube Data API. Below we show how it works with a real check of NASA’s YouTube channel.
What the YouTube subscriber count checker shows
| Metric | What it tells you |
|---|---|
| Subscribers | The live subscriber count (YouTube rounds it for most channels, and the tool shows exactly what YouTube publishes). |
| Total views and videos | Lifetime views, public uploads and average views per video. |
| Engagement rate | Likes and comments per view on recent uploads, graded Low to Excellent. |
| Typical recent video | The median views of recent uploads – what a normal new video really gets. |
| Upload frequency | Uploads per week and when the last one went up. |
| Best upload day and time | Which weekday and hour the channel’s uploads get the most views. |
| Shorts vs videos | How many of each the channel posts, and which gets more views. |
| Top videos and tags | The most viewed recent uploads and the keywords the channel uses. |
| Estimated earnings | A wide range based on typical ad rates – an estimate, not real income. |
| Export | Copy a summary or download every recent video’s stats as a CSV. |
How to check YouTube subscribers (3 easy steps)
Step 1: Paste the channel link or @handle
Open the YouTube Subscriber Count tool. Paste a channel link such as https://www.youtube.com/@NASA, type just the @handle, or paste a link to any video or Short from the channel.
Step 2: Click Show Analytics
Click Show Analytics. The tool fetches the live channel stats and its latest uploads. In a few seconds you see the channel card, subscribers, views, videos and the key numbers.
Step 3: Read the full report
Below the numbers you get the best upload day, best upload time, best format and the most viewed recent upload.
Then scroll for the charts: views of each recent upload, Shorts vs videos, median views by upload day and the estimated earnings range.
You also see the channel’s keywords and its most viewed recent uploads.
Real example: what we found for NASA on YouTube
We ran the tool on NASA’s public channel (@NASA) on 18 November 2026. These are the real results. The tool analysed the channel’s last 47 uploads, from 25 August to 17 November 2026.
| Metric | @NASA result |
|---|---|
| Subscribers | 15.1M (rounded by YouTube) |
| Total views | 1.1B (1,136,362,306) |
| Videos | 6,203 public uploads (joined 4 June 2008) |
| Average views per video (lifetime) | 183.2K |
| Typical recent video | 160.5K median views – about 1.1% of subscribers |
| Engagement rate | 1.58% (graded Average) |
| Upload frequency | 3.8 uploads per week |
| Best upload day | Friday – median 194.5K views (Monday lowest at 82K) |
| Best upload time | 5 PM – 6 PM (shown in the viewer’s local time; our check ran in India time, IST) |
| Shorts vs videos | 45 videos (median 166.5K views) vs 2 Shorts (median 60.5K) |
| Most viewed recent upload | 2M views – Nancy Grace Roman Space Telescope launch (30 Aug 2026) |
What these numbers mean
- Subscribers are not views. NASA has 15.1 million subscribers, but a typical new video gets about 160K views – roughly 1% of subscribers. That is why the “typical recent video” number tells you more than the subscriber count.
- The day matters. NASA’s Friday uploads got more than twice the median views of its Monday uploads (194.5K vs 82K). Every channel is different – check your own niche before choosing your day.
- Long videos win for this channel. NASA’s recent long videos had a median of 166.5K views, against 60.5K for its two Shorts. With only 2 Shorts that is a small sample, so treat it as a hint, not a rule.
- One big event lifts everything. The telescope launch stream reached 2M views, more than 12 times the typical video. Big live events and news moments pull in viewers.
- Engagement depends on settings too. NASA has comments turned off on these uploads, so its engagement rate counts likes only.
How the engagement rate is calculated
The tool adds the likes and comments of the channel’s recent uploads and divides by their views:
Engagement rate = (likes + comments) ÷ views × 100
| Engagement rate (per view) | Grade |
|---|---|
| Under 1.5% | Low |
| 1.5% – 3.5% | Average |
| 3.5% – 6% | High |
| Above 6% | Excellent |
Very large channels often score lower than small ones, because many casual viewers watch without liking. Compare channels of a similar size.
The best upload day compares the median views of uploads by weekday. Uploads less than a week old are left out, because they are still gaining views, and the median stops one viral video from deciding the result.
About the estimated earnings
YouTube earnings are private. The tool shows a wide range based on typical ad revenue of $0.25 to $4 per 1,000 views. For NASA that range was $284.1K – $4.5M lifetime – a very wide estimate, not a fact. Real income depends on the niche, viewers’ countries and sponsorships. Use it only as a rough idea.
Sort videos, copy the summary or download a CSV
Under the charts you get every recent upload with its views, likes and comments. Filter by Videos or Shorts and sort by Latest, Most viewed, Most liked or Most comments. Use Copy summary to paste the key numbers into a report, and Download CSV to open all videos in Excel or Google Sheets. Click Refresh data for the latest numbers.
Who should use a YouTube subscriber count checker?
- Small creators – learn from bigger channels in your niche: upload day, time, format and topics.
- Brands and marketers – check a YouTuber’s typical views and engagement before a sponsorship.
- Agencies – benchmark channels and export the data for client reports.
- Students and researchers – get quick public numbers for any channel.
Works on your phone too
Copy a channel link from the YouTube app, open the tool in your mobile browser and paste it – no app or login needed.
Tips to grow your YouTube channel with this data
- Study 3–5 channels in your niche, not only the biggest ones. Look for patterns in their best day, time and format.
- Test your upload day. Try the strongest day for a few weeks and compare your own results.
- Pick the format that works in your niche. If Shorts clearly beat long videos for similar channels, try more Shorts – and the other way round.
- Upload consistently. A rhythm you can keep beats bursts followed by silence.
- Use the right keywords. Check the tags of top channels for ideas, then write clear titles and descriptions.
- Learn from top videos. Look at what the most viewed uploads have in common: topic, length and title style.
- Grow real subscribers. Bought subscribers don’t watch, so they pull your views per subscriber down.
Frequently asked questions
Is the YouTube subscriber count checker free?
Yes. It is completely free and unlimited. No account, login or credit card is needed.
What can I enter?
A channel URL like https://www.youtube.com/@name, a channel ID link (youtube.com/channel/UC…), a bare @handle, or a link to any video or Short from the channel.
Is the subscriber count live?
Yes. The numbers are fetched from the YouTube Data API when you search. Click “Refresh data” for the latest numbers.
Why is the subscriber count rounded?
YouTube itself publishes rounded subscriber numbers for most channels (for example 15.1M), so the tool shows the same value.
How is the best upload day found?
The tool compares the median views of recent uploads by the weekday they were published, leaving out uploads less than a week old.
Are the earnings real?
No. Earnings are private. The tool shows a wide estimate based on typical ad rates of $0.25–$4 per 1,000 views.
Does the tool need my YouTube login?
No. It reads only public channel data, so you never connect your account and the channel owner is not notified.
Can I download the data?
Yes. Click “Download CSV” to save every recent video with its views, likes and comments, or “Copy summary” to copy the key numbers.
Conclusion: stop guessing, check the data
Subscribers are only the start. Views per video, engagement, the best upload day and the right format tell you what really works. As the NASA example shows, 15.1 million subscribers turn into about 160K views for a typical video, and the upload day can double the views.
Check any channel now with the free YouTube Subscriber Count checker. It is live, free and needs no login.
Check YouTube subscribers now →
More free social media tools
- Instagram Followers Count – followers, reels and engagement of any business or creator account
- X Follower Count – live followers, views and engagement rate
- Pinterest Followers Count – followers, saves and most saved pins
- Threads Followers Count – check Threads profiles
- Facebook Page Followers Count – page followers and post engagement
- Reddit Stats – subreddit members and top posts
Uploading every day but stuck at a few views?
Many creators guess: a shocked-face thumbnail, a “MUST WATCH” title, an upload at a random hour – and hope. A better way is to look at the data of channels that already work: how often they upload, which day and time their videos get the most views, and whether Shorts or long videos do better for them.
YouTube Studio shows this only for your own channel. The free YouTube Subscriber Count tool by WizBrand shows it for any public channel. Paste a channel link or @handle and in a few seconds you get the live subscriber count, total views and videos, plus a full report on the latest uploads: engagement rate, best upload day and time, Shorts vs videos, top videos and the tags the channel uses.
No login and no payment. The data comes straight from the official YouTube Data API. Below we show how it works with a real check of NASA’s YouTube channel.
What the YouTube subscriber count checker shows
| Metric | What it tells you |
|---|---|
| Subscribers | The live subscriber count (YouTube rounds it for most channels, and the tool shows exactly what YouTube publishes). |
| Total views and videos | Lifetime views, public uploads and average views per video. |
| Engagement rate | Likes and comments per view on recent uploads, graded Low to Excellent. |
| Typical recent video | The median views of recent uploads – what a normal new video really gets. |
| Upload frequency | Uploads per week and when the last one went up. |
| Best upload day and time | Which weekday and hour the channel’s uploads get the most views. |
| Shorts vs videos | How many of each the channel posts, and which gets more views. |
| Top videos and tags | The most viewed recent uploads and the keywords the channel uses. |
| Estimated earnings | A wide range based on typical ad rates – an estimate, not real income. |
| Export | Copy a summary or download every recent video’s stats as a CSV. |
How to check YouTube subscribers (3 easy steps)
Step 1: Paste the channel link or @handle
Open the YouTube Subscriber Count tool. Paste a channel link such as https://www.youtube.com/@NASA, type just the @handle, or paste a link to any video or Short from the channel.
Step 2: Click Show Analytics
Click Show Analytics. The tool fetches the live channel stats and its latest uploads. In a few seconds you see the channel card, subscribers, views, videos and the key numbers.
Step 3: Read the full report
Below the numbers you get the best upload day, best upload time, best format and the most viewed recent upload.
Then scroll for the charts: views of each recent upload, Shorts vs videos, median views by upload day and the estimated earnings range.
You also see the channel’s keywords and its most viewed recent uploads.
Real example: what we found for NASA on YouTube
We ran the tool on NASA’s public channel (@NASA) on 18 November 2026. These are the real results. The tool analysed the channel’s last 47 uploads, from 25 August to 17 November 2026.
| Metric | @NASA result |
|---|---|
| Subscribers | 15.1M (rounded by YouTube) |
| Total views | 1.1B (1,136,362,306) |
| Videos | 6,203 public uploads (joined 4 June 2008) |
| Average views per video (lifetime) | 183.2K |
| Typical recent video | 160.5K median views – about 1.1% of subscribers |
| Engagement rate | 1.58% (graded Average) |
| Upload frequency | 3.8 uploads per week |
| Best upload day | Friday – median 194.5K views (Monday lowest at 82K) |
| Best upload time | 5 PM – 6 PM (shown in the viewer’s local time; our check ran in India time, IST) |
| Shorts vs videos | 45 videos (median 166.5K views) vs 2 Shorts (median 60.5K) |
| Most viewed recent upload | 2M views – Nancy Grace Roman Space Telescope launch (30 Aug 2026) |
What these numbers mean
- Subscribers are not views. NASA has 15.1 million subscribers, but a typical new video gets about 160K views – roughly 1% of subscribers. That is why the “typical recent video” number tells you more than the subscriber count.
- The day matters. NASA’s Friday uploads got more than twice the median views of its Monday uploads (194.5K vs 82K). Every channel is different – check your own niche before choosing your day.
- Long videos win for this channel. NASA’s recent long videos had a median of 166.5K views, against 60.5K for its two Shorts. With only 2 Shorts that is a small sample, so treat it as a hint, not a rule.
- One big event lifts everything. The telescope launch stream reached 2M views, more than 12 times the typical video. Big live events and news moments pull in viewers.
- Engagement depends on settings too. NASA has comments turned off on these uploads, so its engagement rate counts likes only.
How the engagement rate is calculated
The tool adds the likes and comments of the channel’s recent uploads and divides by their views:
Engagement rate = (likes + comments) ÷ views × 100
| Engagement rate (per view) | Grade |
|---|---|
| Under 1.5% | Low |
| 1.5% – 3.5% | Average |
| 3.5% – 6% | High |
| Above 6% | Excellent |
Very large channels often score lower than small ones, because many casual viewers watch without liking. Compare channels of a similar size.
The best upload day compares the median views of uploads by weekday. Uploads less than a week old are left out, because they are still gaining views, and the median stops one viral video from deciding the result.
About the estimated earnings
YouTube earnings are private. The tool shows a wide range based on typical ad revenue of $0.25 to $4 per 1,000 views. For NASA that range was $284.1K – $4.5M lifetime – a very wide estimate, not a fact. Real income depends on the niche, viewers’ countries and sponsorships. Use it only as a rough idea.
Sort videos, copy the summary or download a CSV
Under the charts you get every recent upload with its views, likes and comments. Filter by Videos or Shorts and sort by Latest, Most viewed, Most liked or Most comments. Use Copy summary to paste the key numbers into a report, and Download CSV to open all videos in Excel or Google Sheets. Click Refresh data for the latest numbers.
Who should use a YouTube subscriber count checker?
- Small creators – learn from bigger channels in your niche: upload day, time, format and topics.
- Brands and marketers – check a YouTuber’s typical views and engagement before a sponsorship.
- Agencies – benchmark channels and export the data for client reports.
- Students and researchers – get quick public numbers for any channel.
Works on your phone too
Copy a channel link from the YouTube app, open the tool in your mobile browser and paste it – no app or login needed.
Tips to grow your YouTube channel with this data
- Study 3–5 channels in your niche, not only the biggest ones. Look for patterns in their best day, time and format.
- Test your upload day. Try the strongest day for a few weeks and compare your own results.
- Pick the format that works in your niche. If Shorts clearly beat long videos for similar channels, try more Shorts – and the other way round.
- Upload consistently. A rhythm you can keep beats bursts followed by silence.
- Use the right keywords. Check the tags of top channels for ideas, then write clear titles and descriptions.
- Learn from top videos. Look at what the most viewed uploads have in common: topic, length and title style.
- Grow real subscribers. Bought subscribers don’t watch, so they pull your views per subscriber down.
Frequently asked questions
Is the YouTube subscriber count checker free?
Yes. It is completely free and unlimited. No account, login or credit card is needed.
What can I enter?
A channel URL like https://www.youtube.com/@name, a channel ID link (youtube.com/channel/UC…), a bare @handle, or a link to any video or Short from the channel.
Is the subscriber count live?
Yes. The numbers are fetched from the YouTube Data API when you search. Click “Refresh data” for the latest numbers.
Why is the subscriber count rounded?
YouTube itself publishes rounded subscriber numbers for most channels (for example 15.1M), so the tool shows the same value.
How is the best upload day found?
The tool compares the median views of recent uploads by the weekday they were published, leaving out uploads less than a week old.
Are the earnings real?
No. Earnings are private. The tool shows a wide estimate based on typical ad rates of $0.25–$4 per 1,000 views.
Does the tool need my YouTube login?
No. It reads only public channel data, so you never connect your account and the channel owner is not notified.
Can I download the data?
Yes. Click “Download CSV” to save every recent video with its views, likes and comments, or “Copy summary” to copy the key numbers.
Conclusion: stop guessing, check the data
Subscribers are only the start. Views per video, engagement, the best upload day and the right format tell you what really works. As the NASA example shows, 15.1 million subscribers turn into about 160K views for a typical video, and the upload day can double the views.
Check any channel now with the free YouTube Subscriber Count checker. It is live, free and needs no login.
Check YouTube subscribers now →
More free social media tools
- Instagram Followers Count – followers, reels and engagement of any business or creator account
- X Follower Count – live followers, views and engagement rate
- Pinterest Followers Count – followers, saves and most saved pins
- Threads Followers Count – check Threads profiles
- Facebook Page Followers Count – page followers and post engagement
- Reddit Stats – subreddit members and top posts
